
From Overworked Teacher to Activated Classroom Team
Becoming a co-founder fresh out of a design bootcamp, I was a bit naive about the scope and variety of responsibilities I was walking into. But when you’re building something truly meaningful, and the people you’re building it for are part of the most overworked workforce in the United States, you step up. Fail fast. Move forward. Repeat.
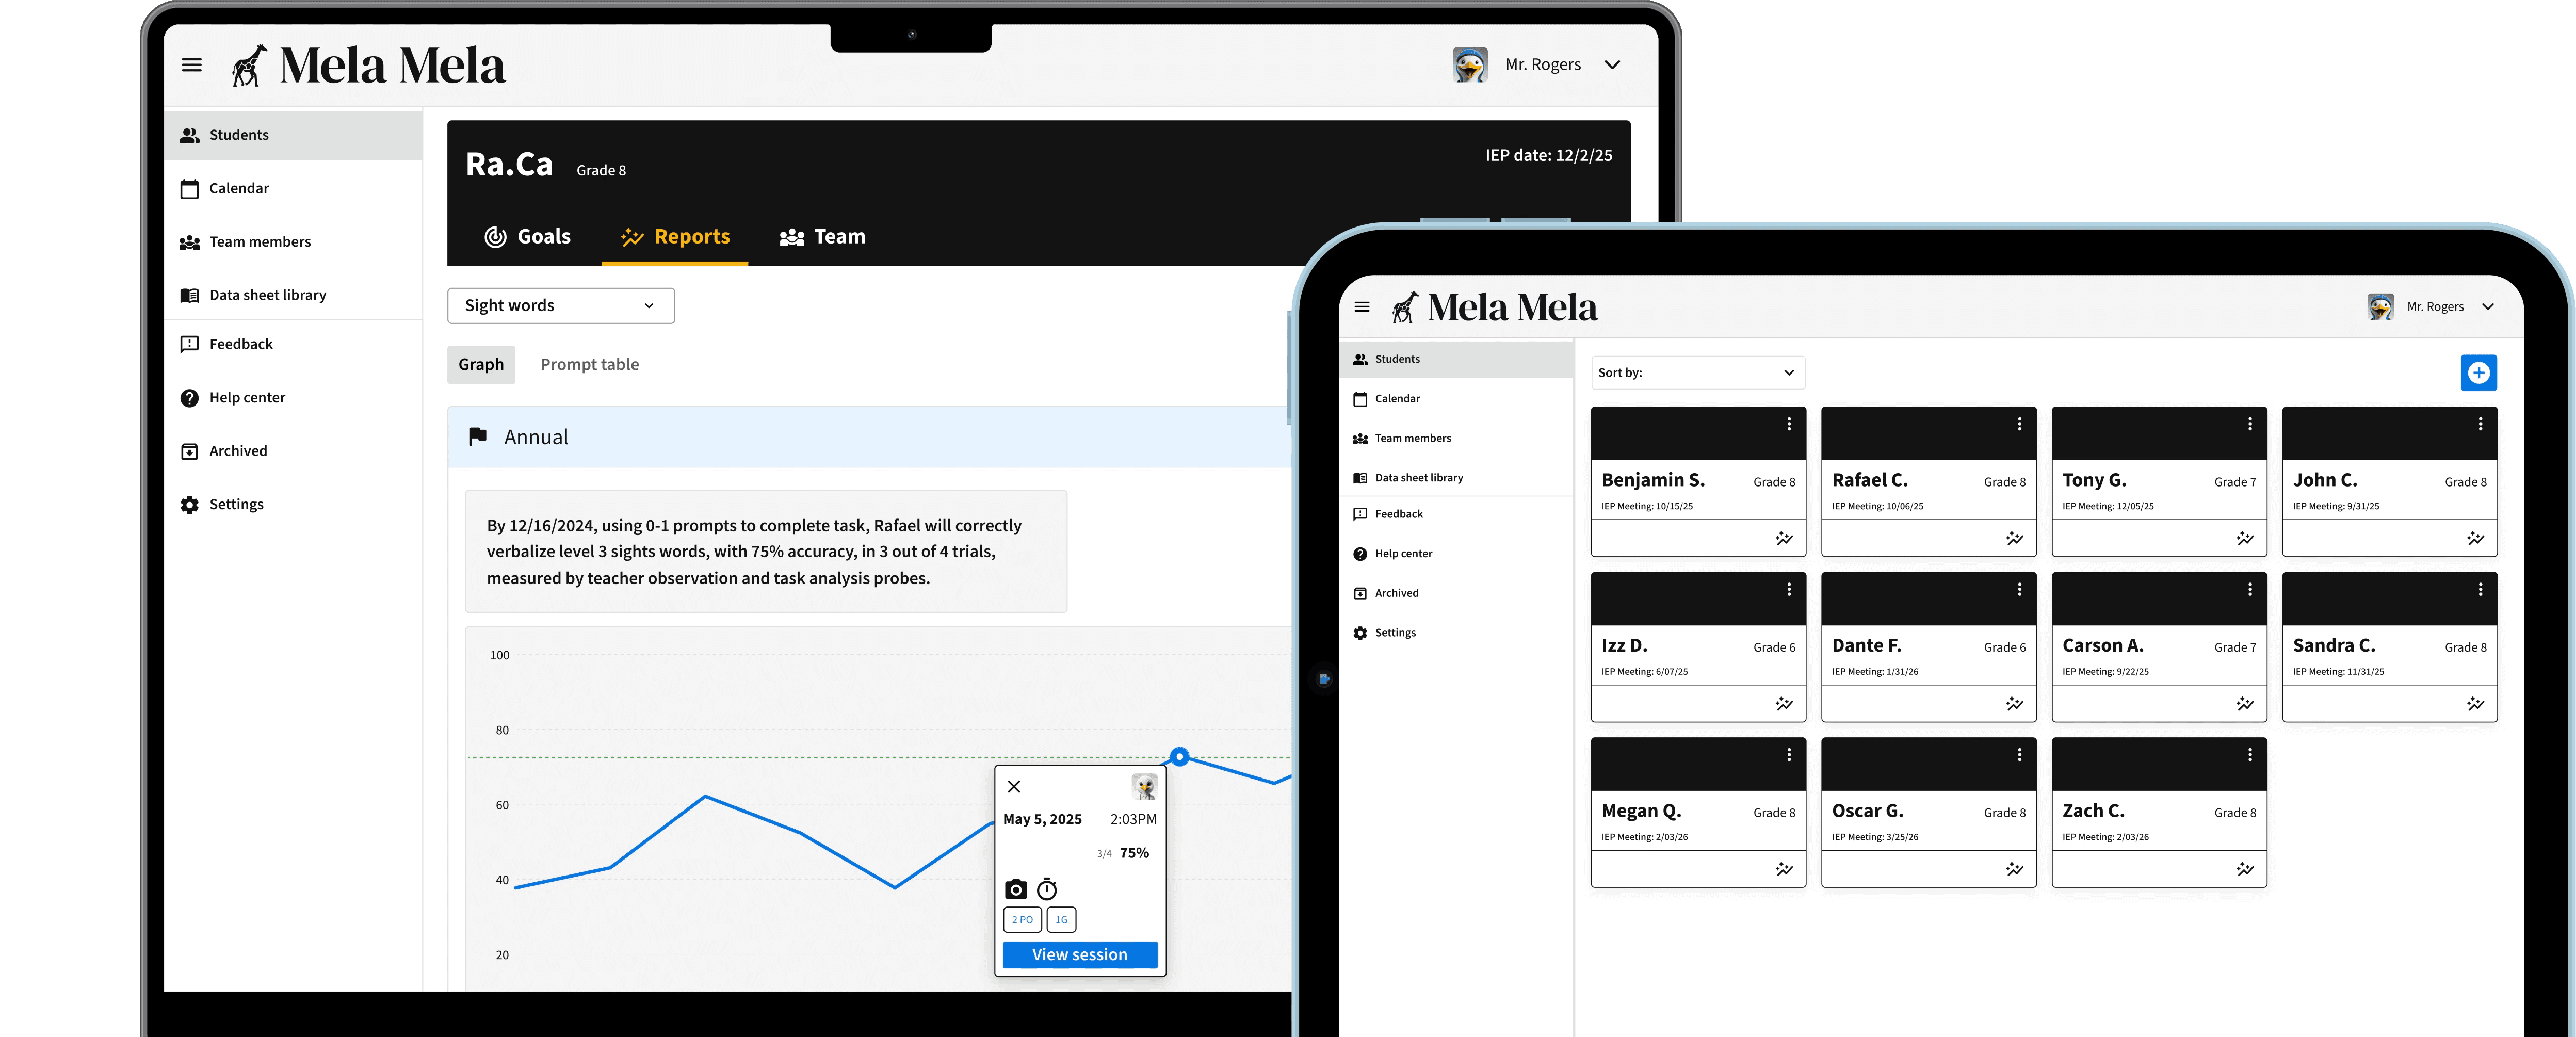
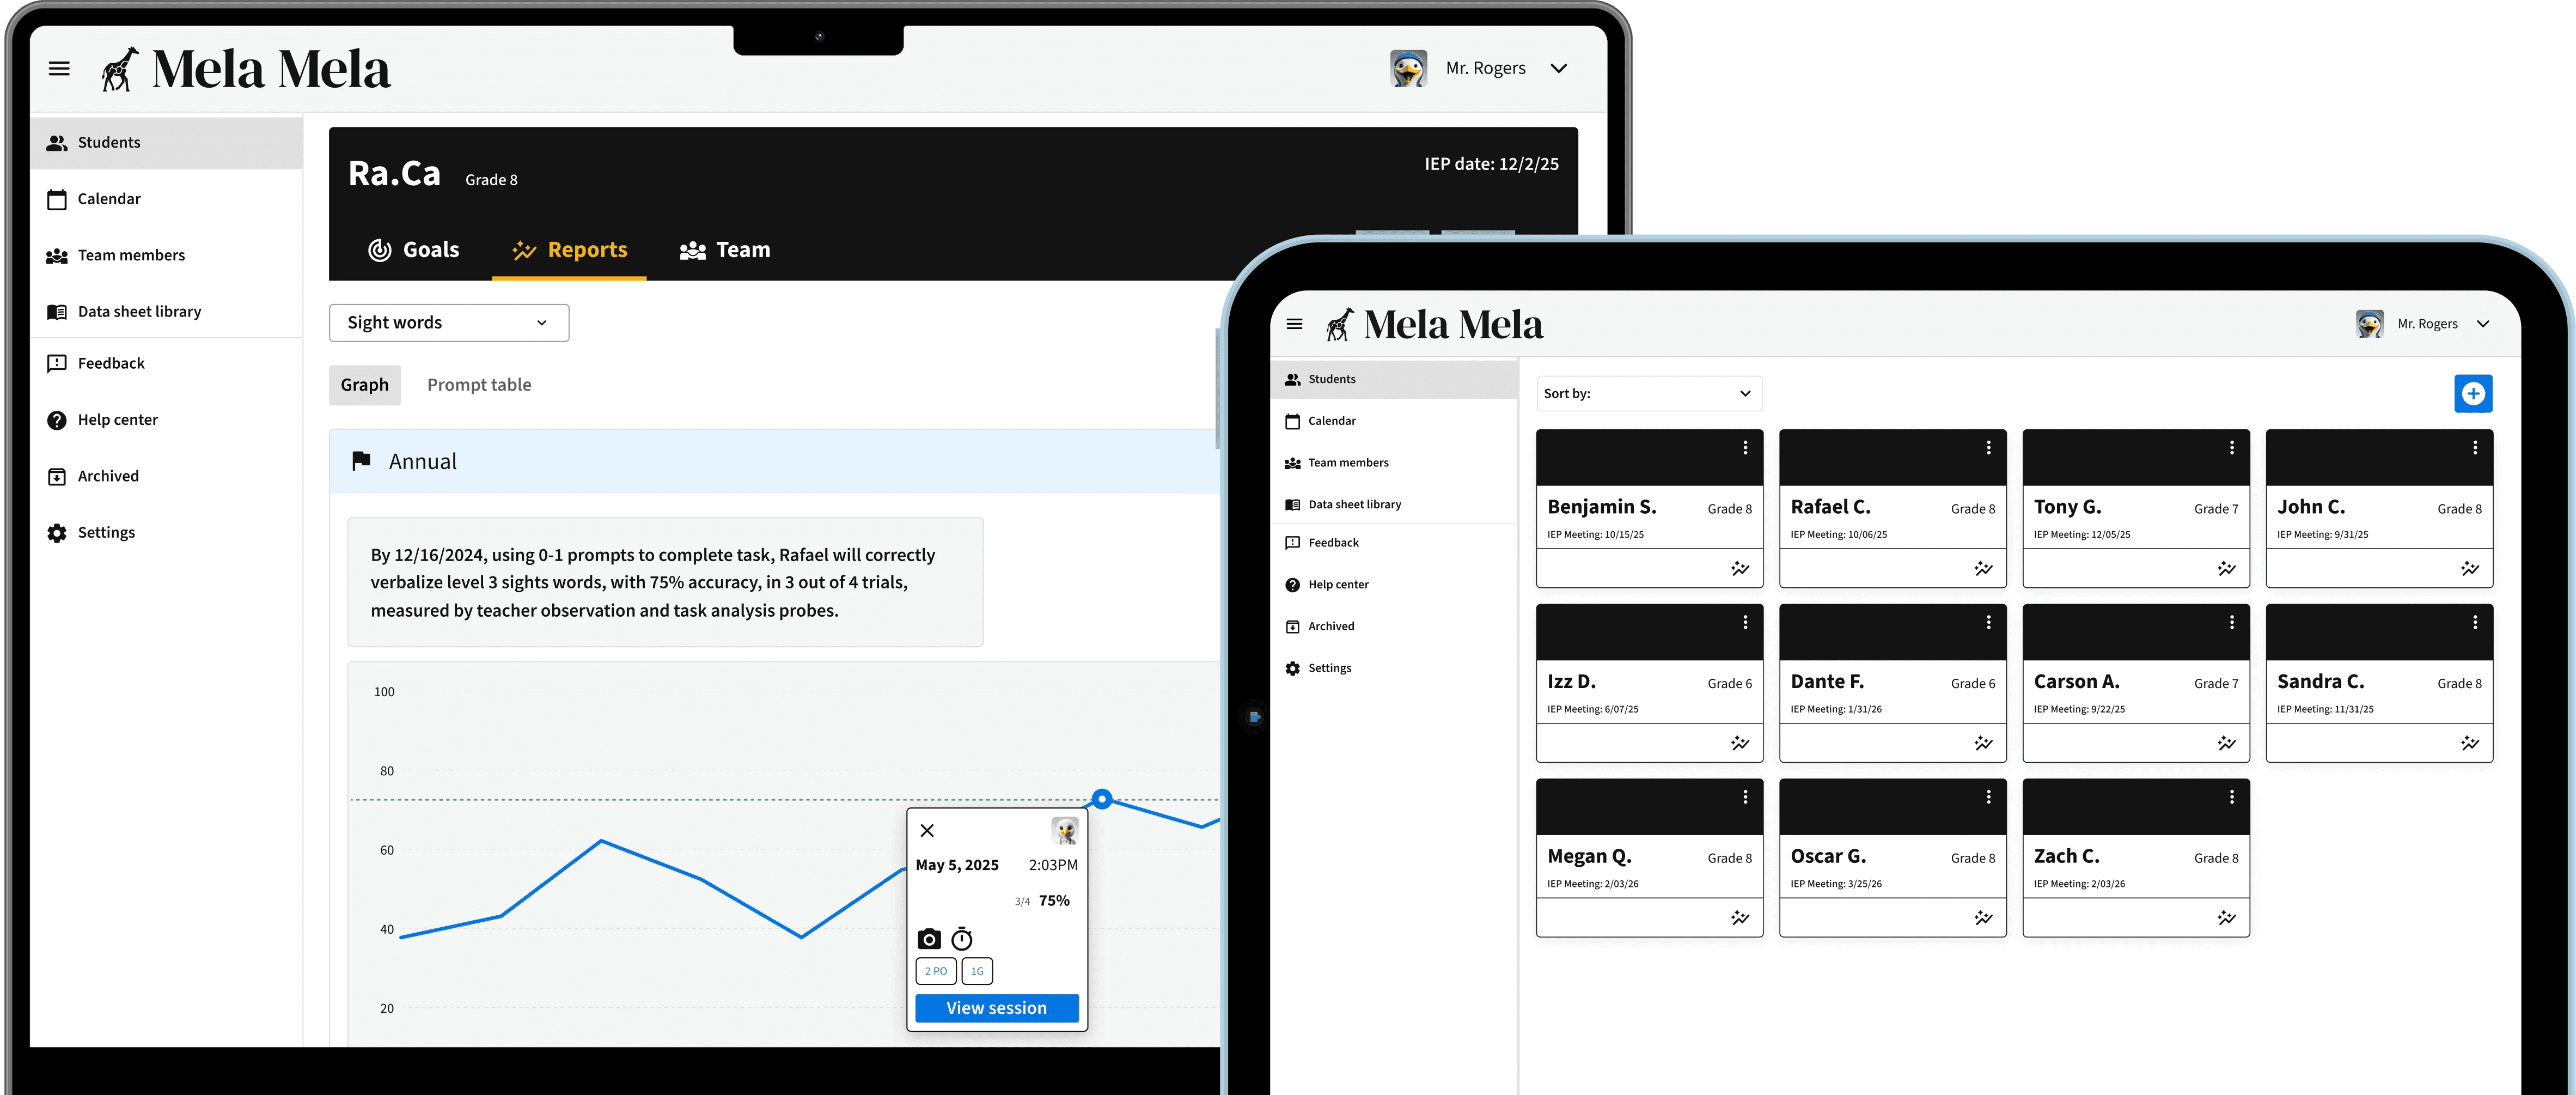
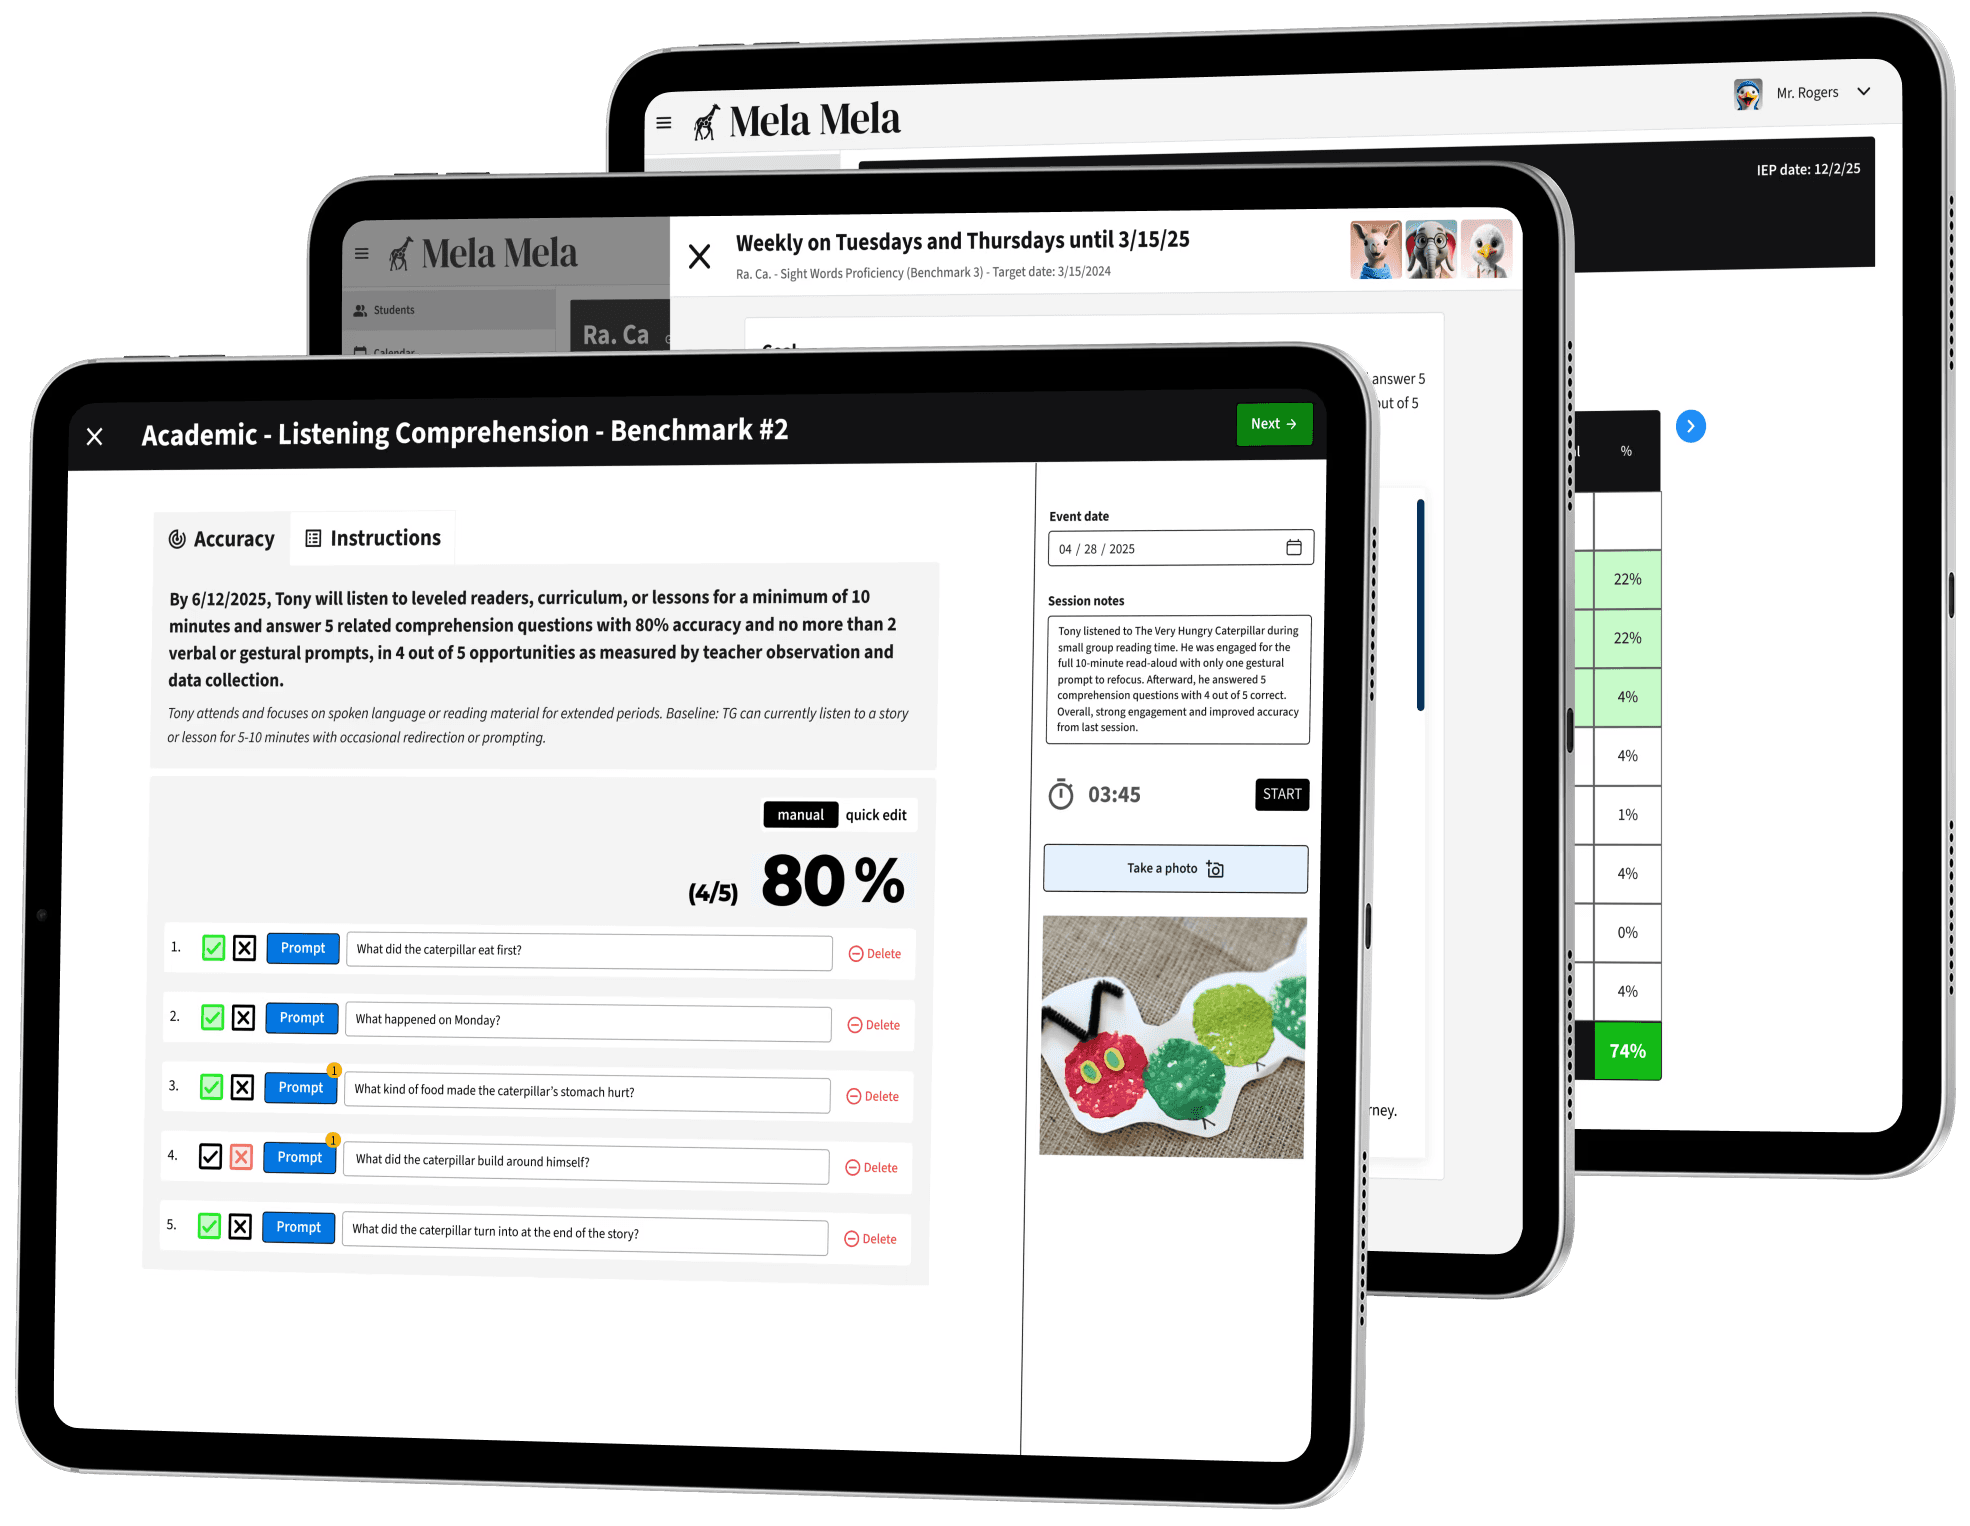
I designed and managed the Mela Mela product from 0 to 1. A data collection and classroom management workspace designed to fill the gaps in existing systems. Today, it’s a live product, supporting education professionals in their day-to-day workflows.
Becoming a co-founder fresh out of a design bootcamp, I was a bit naive about the scope and variety of responsibilities I was walking into. But when you’re building something truly meaningful, and the people you’re building it for are part of the most overworked workforce in the United States, you step up. Fail fast. Move forward. Repeat.
I designed and managed the Mela Mela product from 0 to 1. A data collection and classroom management workspace designed to fill the gaps in existing systems. Today, it’s a live product, supporting education professionals in their day-to-day workflows.
My Role
Product Designer + Product Manager
Time frame:
March 24’ - Present
Industry:
Education, B2B
My Role
Product Designer +
Product Manager
Time frame:
March 24’ - Present
Industry:
Education
My Role
Product Designer + Product Manager
Time frame:
March 24’ - Present
Industry:
Education
95%
reduction in time spent synthesizing data
$720
estimated recovered time value per teacher, per year
600
average submitted data collection events per month
BACKGROUND
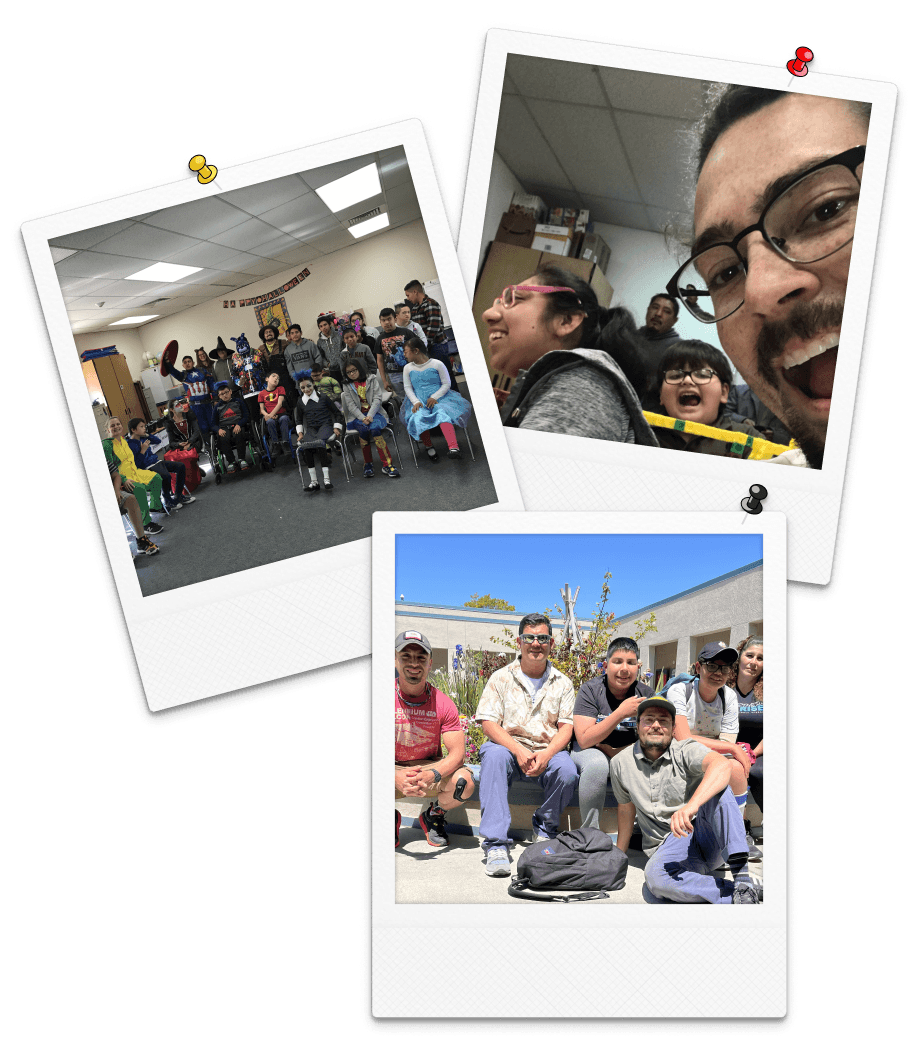
Humble Classroom Beginnings
The idea for Mela Mela began in my final years as a teacher, when I saw how fragile my workflows were. Existing tools simply weren’t built for the realities of special education.
After thousands of hours in the classroom, I knew the stress of falling behind on data collection and progress monitoring. That constant pressure left many teachers feeling like they weren’t doing enough — a major driver of burnout. Mela Mela was my answer: a modern, streamlined workflow for data collection and caseload management.

MACRO PROBLEM
Special Education Teacher Attrition Crisis
Special education teacher attrition is at a crisis level in the United States. Turnover is costly for school districts, and even more importantly, it disrupts the consistency and care that students rely on.
Special education teacher attrition is at a crisis level in the United States. Turnover is costly for school districts, and even more importantly, it disrupts the consistency and care that students rely on.
THE PROBLEM
A "five alarm fire"
Special education teachers are turning over at alarming rate.
50%
leave within 5 years
1
Losing a single 1-year teacher costs districts $7-25K
2.5x
more likely to leave
2
Special education teachers have a 13% annual attrition rate, more than double the rate of general education teachers.
Nationwide shortages
98% of US school districts report special education teacher shortages. 2 of 3 recruits enter the classroom before completing a credential program.
Lower student achievement
Poor student outcomes correlate significantly with higher turnover rates.
Underserved populations
disproportionally impacted
Special education is the area of greatest teacher shortage in the 200 largest US cities. Shortages are greatest in high poverty areas.
THE PROBLEM
A "five alarm fire"
Special education teachers are turning over at alarming rate.
50%
leave within 5 years
Losing a single 1-year teacher costs districts $7-25K
2.5x
more likely to leave
Special education teachers have a 13% annual attrition rate, more than double the rate of general education teachers.
Nationwide shortages
98% of US school districts report special education teacher shortages. 2 of 3 recruits enter the classroom before completing a credential program.
Lower student achievement
Poor student outcomes correlate significantly with higher turnover rates.
Underserved populations disproportionally impacted
Special education is the area of greatest teacher shortage in the 200 largest US cities. Shortages are greatest in high poverty areas.
1
Gilmour, A., Mason-Williams, L., & Bettini, E. (2024). How the special education teacher shortage
affects students with LD, and what to do about it. Learning Disabilities Association of America.
https://ldaamerica.org/how-the-special-education-teacher-shortage-affects-students-with-ld-and-
1
Gilmour, A., Mason-Williams, L., & Bettini, E. (2024). How the special education teacher shortage
affects students with LD, and what to do about it. Learning Disabilities Association of America.
https://ldaamerica.org/how-the-special-education-teacher-shortage-affects-students-with-ld-and-
MICRO PROBLEM
How are teachers impacted day-to-day?
Special education teachers are asked to do it all: manage student caseloads (Individualized Education Programs), track progress data, generate lessons, collaborate with team, and communicate with families, often with fragmented tools and systems.
The result is a system that pushes even the most dedicated educators to the edge of burnout.
“Some days, special education feels like it’s stuck in the past. We’re expected to do so much with a large caseload of students, and somehow just make it work. The weight of this work never leaves me.”
— Rose T. (Special Education Teacher, 9 years experience)
“Some days, special education feels like it’s stuck in the past. We’re expected to do so much with a large caseload of students, and somehow just make it work. The weight of this work never leaves me.”
— Rose T. (Special Education Teacher, 9 years experience)
“Some days, special education feels like it’s stuck in the past. We’re expected to do so much with a large caseload of students, and somehow just make it work. The weight of this work never leaves me.”
— Rose T. (Special Education Teacher, 9 years experience)
PRE MVP RESEARCH
Understanding and Analyzing the Status Quo
I conducted surveys, interviews, and a competitive analysis to better understand the current landscape. These early inputs surfaced real pain points, challenged my assumptions, and shaped the direction of my first MVP concepts.
I conducted surveys, interviews, and a competitive analysis to better understand the current landscape. These early inputs surfaced real pain points, challenged my assumptions, and shaped the direction of my first MVP concepts.
KEY INSIGHT #1A: DATA COLLECTION SYSTEM
Method:
Method:
Survey
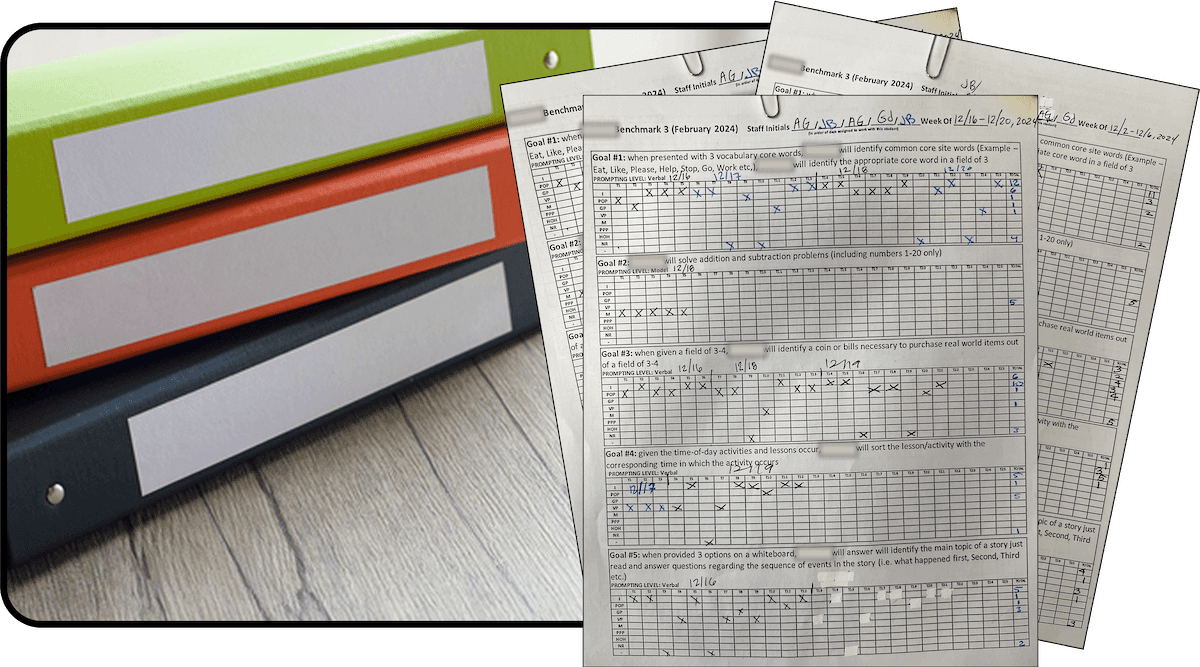
Takeaway: The majority of teachers use a traditional data collection method rooted in student binders with customized paper data sheets for student goals. More technology forward teachers used Google Sheets/Excel to document progress.
Takeaway: The majority of teachers use a traditional data collection method rooted in student binders with customized paper data sheets for student goals. More technology forward teachers used Google Sheets/Excel to document progress.
KEY INSIGHT #1B: DATA COLLECTION TYPE
Method:
Method:
Survey
Takeaway: Identifying accuracy (% correct) and task analysis as the most common methods helped us narrow MVP requirements to focus on what teachers actually use day-to-day.
Takeaway: Identifying accuracy (% correct) and task analysis as the most common methods helped us narrow MVP requirements to focus on what teachers actually use day-to-day.
What type of data collection is used in your classroom?

KEY INSIGHT #2
Method:
Method:
Fly-on-the-Wall Observation
Contextual Inquiry
Takeaway: Teachers were overwhelmed with leadership responsibilities, while paraprofessionals, who outnumbered teachers 4:1 or more, had no clear process for collecting data. Classroom teams didn't have a consistent strategy resulting in months behind on progress monitoring. Paper/binder system was outdated and disorganized. This highlighted a critical gap between assumed workflows and day-to-day realities.
Takeaway: Teachers were overwhelmed with leadership responsibilities, while paraprofessionals, who outnumbered teachers 4:1 or more, had no clear process for collecting data. Classroom teams didn't have a consistent strategy resulting in months behind on progress monitoring. Paper/binder system was outdated and disorganized. This highlighted a critical gap between assumed workflows and day-to-day realities.
It takes a lot of time and energy to develop activities and then communicate expectations so paraprofessionals can take data. The data sheets need to be ready and the activity has to match the goal and I sometimes need to teach the paraprofessionals how to take data on that goal."
— Mario (Teacher, 8 years experience)
“I don’t have data sheets for every goal. Each day I’m falling more and more behind and I feel really bad about it.”
— Olga (Teacher, 2 years experience)
“I don’t have data sheets for every goal. Each day I’m falling more and more behind and I feel really bad about it.”
— Olga (Teacher, 2 years experience)
“I don’t have data sheets for every goal. Each day I’m falling more and more behind and I feel really bad about it.”
— Olga (Teacher, 2 years experience)
KEY INSIGHT #3
Method:
Method:
Competitive SWOT Analysis
Takeaway: The special education EdTech market is crowded with robust, all-in-one platforms, but complexity, poor device compatibility, and lack of paraprofessional support create major usability gaps.
There’s a clear opportunity to differentiate through simple, team-centered design, and partnerships with under-supported districts still relying on paper.


Strengths
Impressive & robust: unified platforms reduce reliance on paper by centralizing IEPs, behavior, and communication
Collaborative workflows: tools improving collaboration across teachers, paras, and specialists
Data compliance: products meeting FERPA and HIPPA compliance
Impressive & robust: unified platforms reduce reliance on paper by centralizing IEPs, behavior, and communication
Collaborative workflows: tools improving collaboration across teachers, paras, and specialists
Data compliance: products meeting FERPA and HIPPA compliance
Weakness
Cluttered UX: feature fatigue and cognitive overload creates risk of usability issues for busy and less tech savy classrooms
Adoption hurdles: steep learning curves slows adoption and require heavy onboarding
Device friction: complex user interfaces surfaces poor user experience on smaller screens
Cluttered UX: feature fatigue and cognitive overload creates risk of usability issues for busy and less tech savy classrooms
Adoption hurdles: steep learning curves slows adoption and require heavy onboarding
Device friction: complex user interfaces surfaces poor user experience on smaller screens
Opportunities
Untapped workforce: clear opportunity to engage periphery team members competitors don't support
UX simplicity: support less technical users with an interface that's easy to learn and use
Adoption opportunity: districts still using paper systems offer early adoption opportunities
Untapped workforce: clear opportunity to engage periphery team members competitors don't support
UX simplicity: support less technical users with an interface that's easy to learn and use
Adoption opportunity: districts still using paper systems offer early adoption opportunities
Threats
Market saturation: crowded market makes differentiation challenging as platforms offer similar benefits
Sales friction: slow EdTech procurement cycles delay adoption
Market saturation: crowded market makes differentiation challenging as platforms offer similar benefits
Sales friction: slow EdTech procurement cycles delay adoption
Research Retrospective
Conducting research with overworked special education teams came with real limitations. Time with teachers was often short and unpredictable, making it challenging to go deep during interviews.
No competitor has a strong hold on this space, and teachers continue struggle with outdated or non-existent tools. The takeaway? There’s a significant opportunity to build a platform that fits into realities of classrooms.
How I would conduct research differently:
Offer compensation and flexibility by funding after-hours sessions and building in low-pressure options like lunch interviews
Prioritize contextual research by spending more time inside classrooms to observe realities that interviews or data might not reveal
Engage paraprofessionals early as they can hold key insights
HOW MIGHT WE…
Reimagine a digital experience that solves data collection pain points and aligns with current classroom workflows and mental models?
HOW MIGHT WE…
Reimagine a digital experience that solves data collection pain points and aligns with current classroom workflows and mental models?
Reimagine a digital experience that solves data collection pain points and aligns with current classroom workflows and mental models?
MVP STRATEGY
Paraprofessional-First Approach
Discovery and a competitive audit revealed a gap: no tools served paraprofessionals. I designed a simple, paraprofessional-centered experience that made logging progress quick and consistent, allowing lead teachers to step back into a guiding role without extra tasks.
Discovery and a competitive audit revealed a gap: no tools served paraprofessionals. I designed a simple, paraprofessional-centered experience that made logging progress quick and consistent, allowing lead teachers to step back into a guiding role without extra tasks.
TEACHER: "As a teacher, my focus is on providing the best possible education for my students. I need tools that streamline my workload, support collaboration with colleagues, and help me track student progress effectively to personalize their learning journey."
TEACHER: "As a teacher, my focus is on providing the best possible education for my students. I need tools that streamline my workload, support collaboration with colleagues, and help me track student progress effectively to personalize their learning journey."

PARAPROFESSIONAL: "As a paraprofessional, I’m here to support my lead teacher and help students work toward independence. I need tools that are easy to use, clearly show me what to work on, and make it simple to track what’s happening with each student."
PARAPROFESSIONAL: "As a paraprofessional, I’m here to support my lead teacher and help students work toward independence. I need tools that are easy to use, clearly show me what to work on, and make it simple to track what’s happening with each student."
Impact of Paraprofessional-First Strategy
Classroom Impact
Business impact
Engaging staff who spend the most time with students
Strengthens our value proposition by supporting the backbone of instruction
Expanding participation in data collection beyond lead teachers
Broadens out total addressable market and positions us as a district-wide solution
Providing accessible tools that are simple, clear, and aligned with daily workflows
Increases platform adoption across the entire classroom team, not just teachers
Classroom Impact
Business impact
Engaging staff who spend the most time with students
Strengthens our value proposition by supporting the backbone of instruction
Expanding participation in data collection beyond lead teachers
Broadens out total addressable market and positions us as a district-wide solution
Providing tools that are simple, clear, and aligned with daily workflows
Increases platform adoption across the entire classroom team, not just teachers
MVP Solution
1
Student Cards
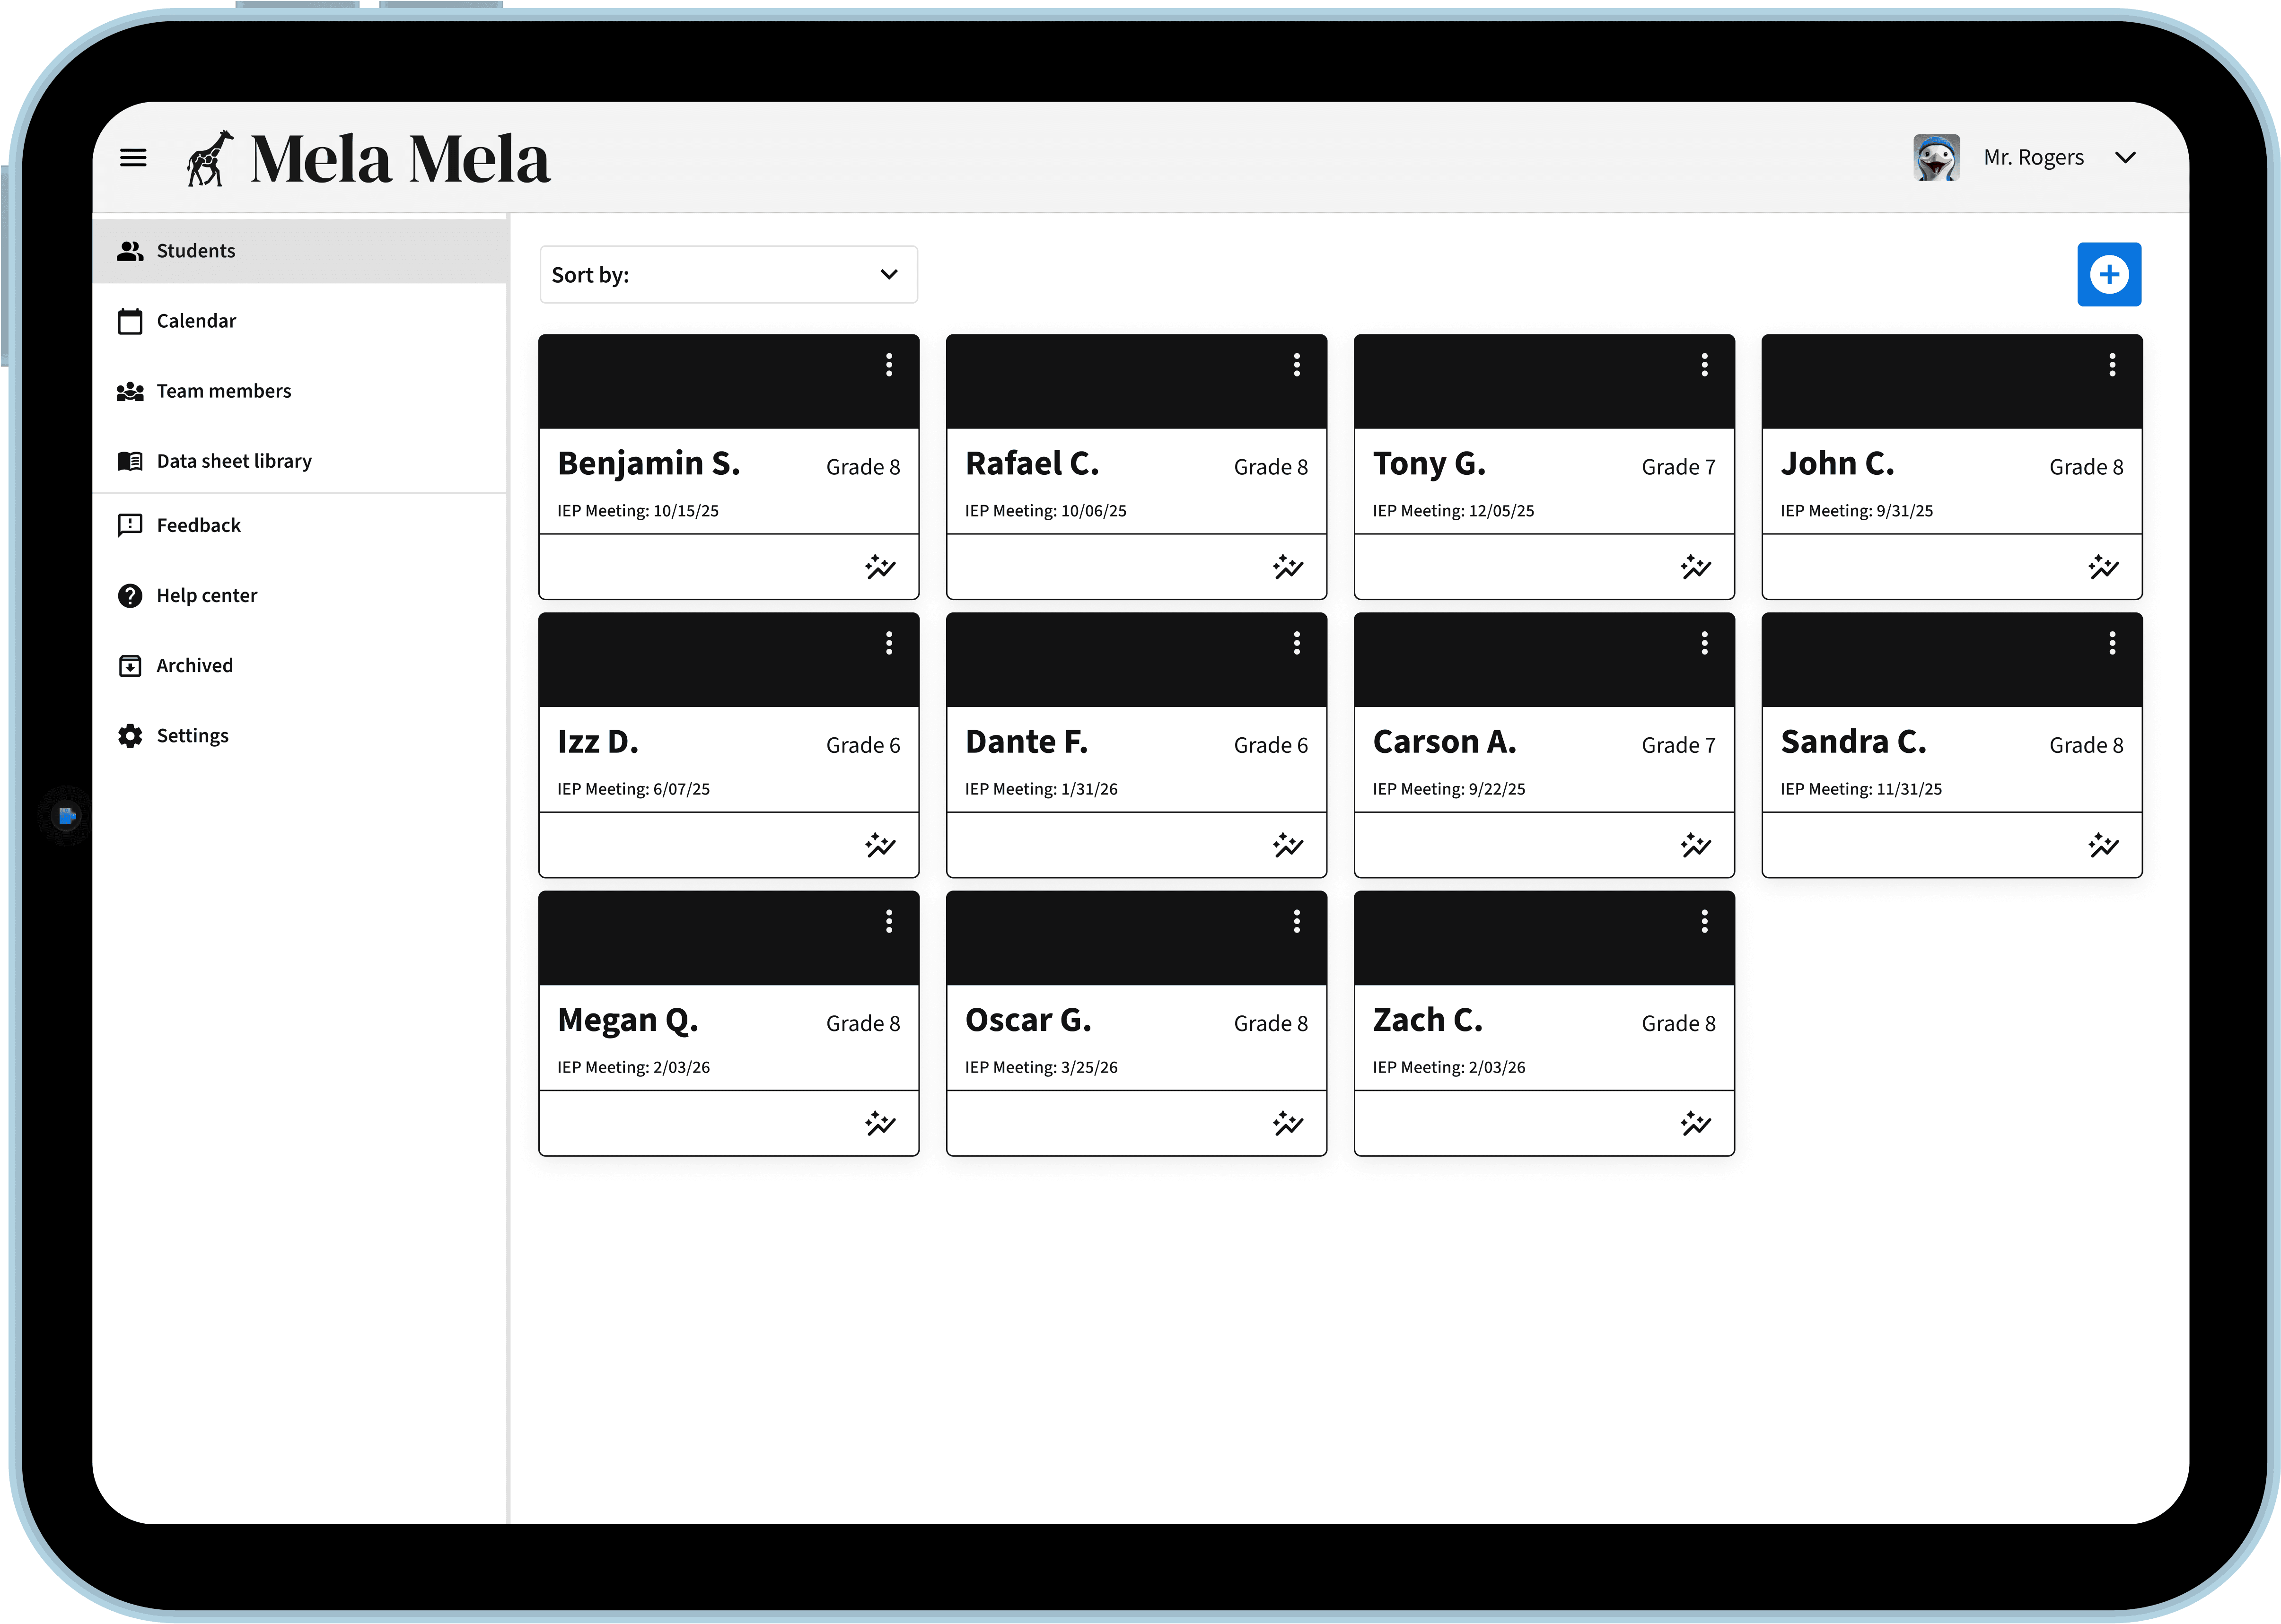
2
Student Dashboard
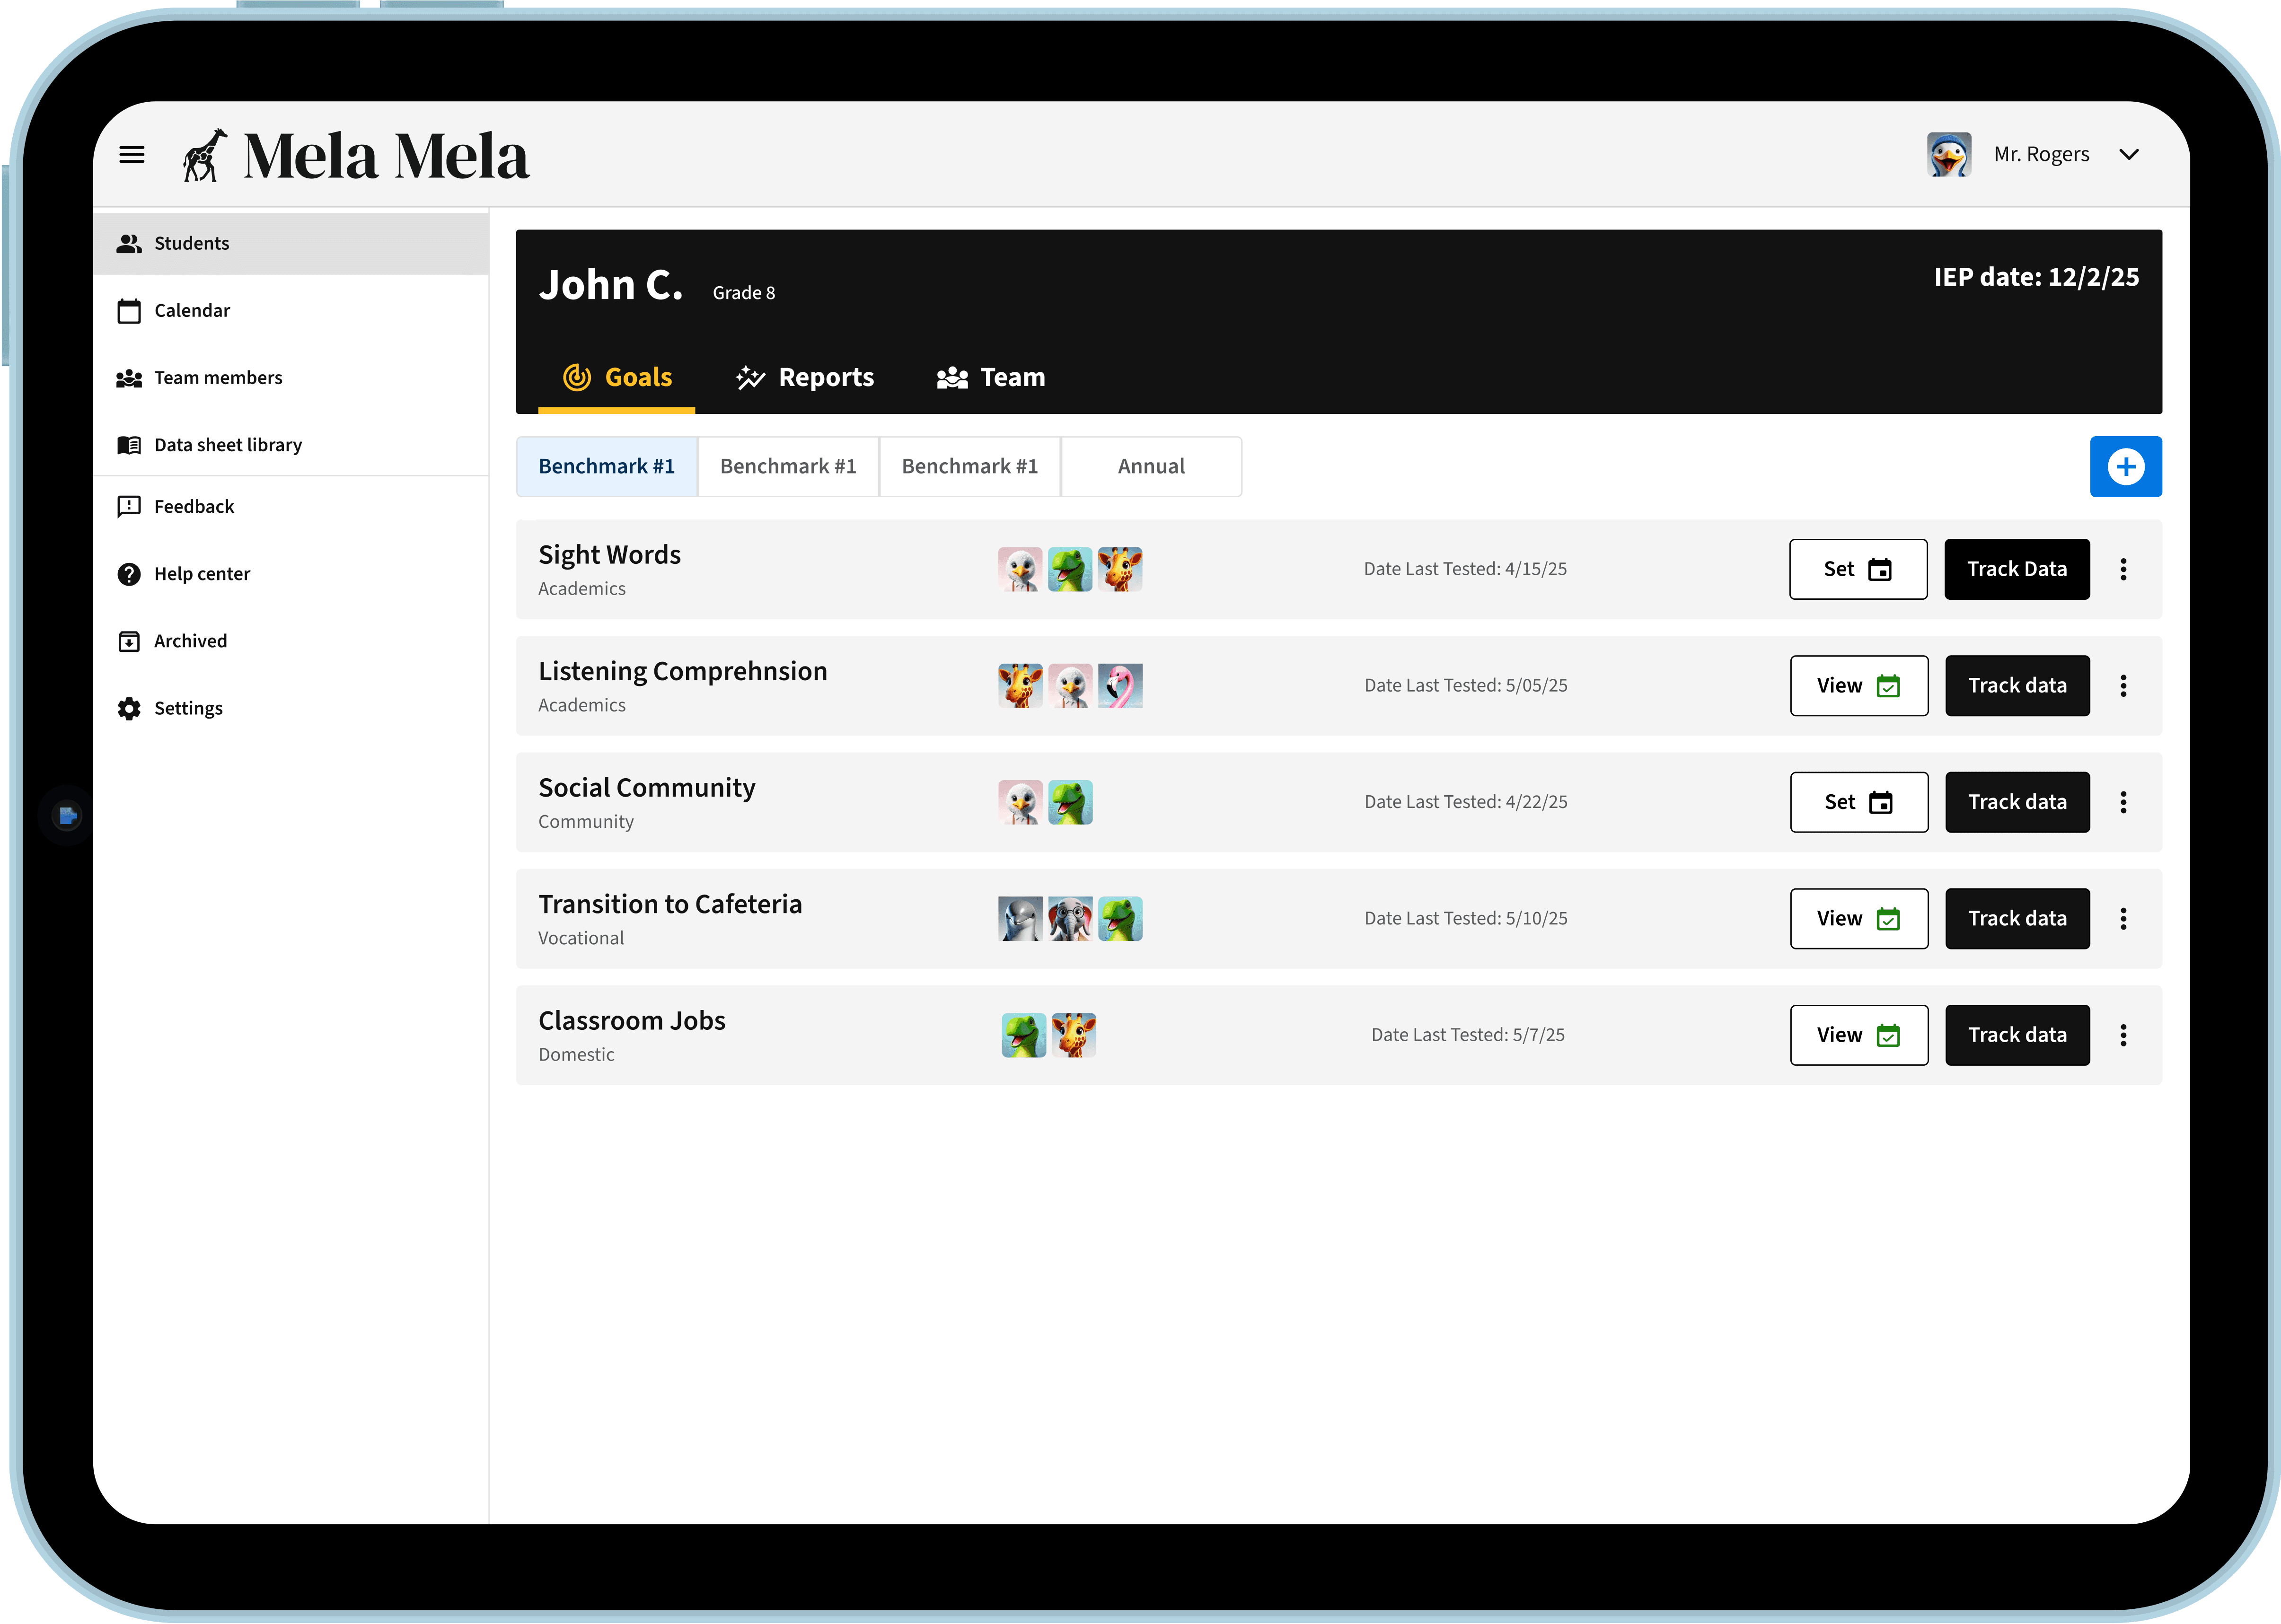
3
Data Collection
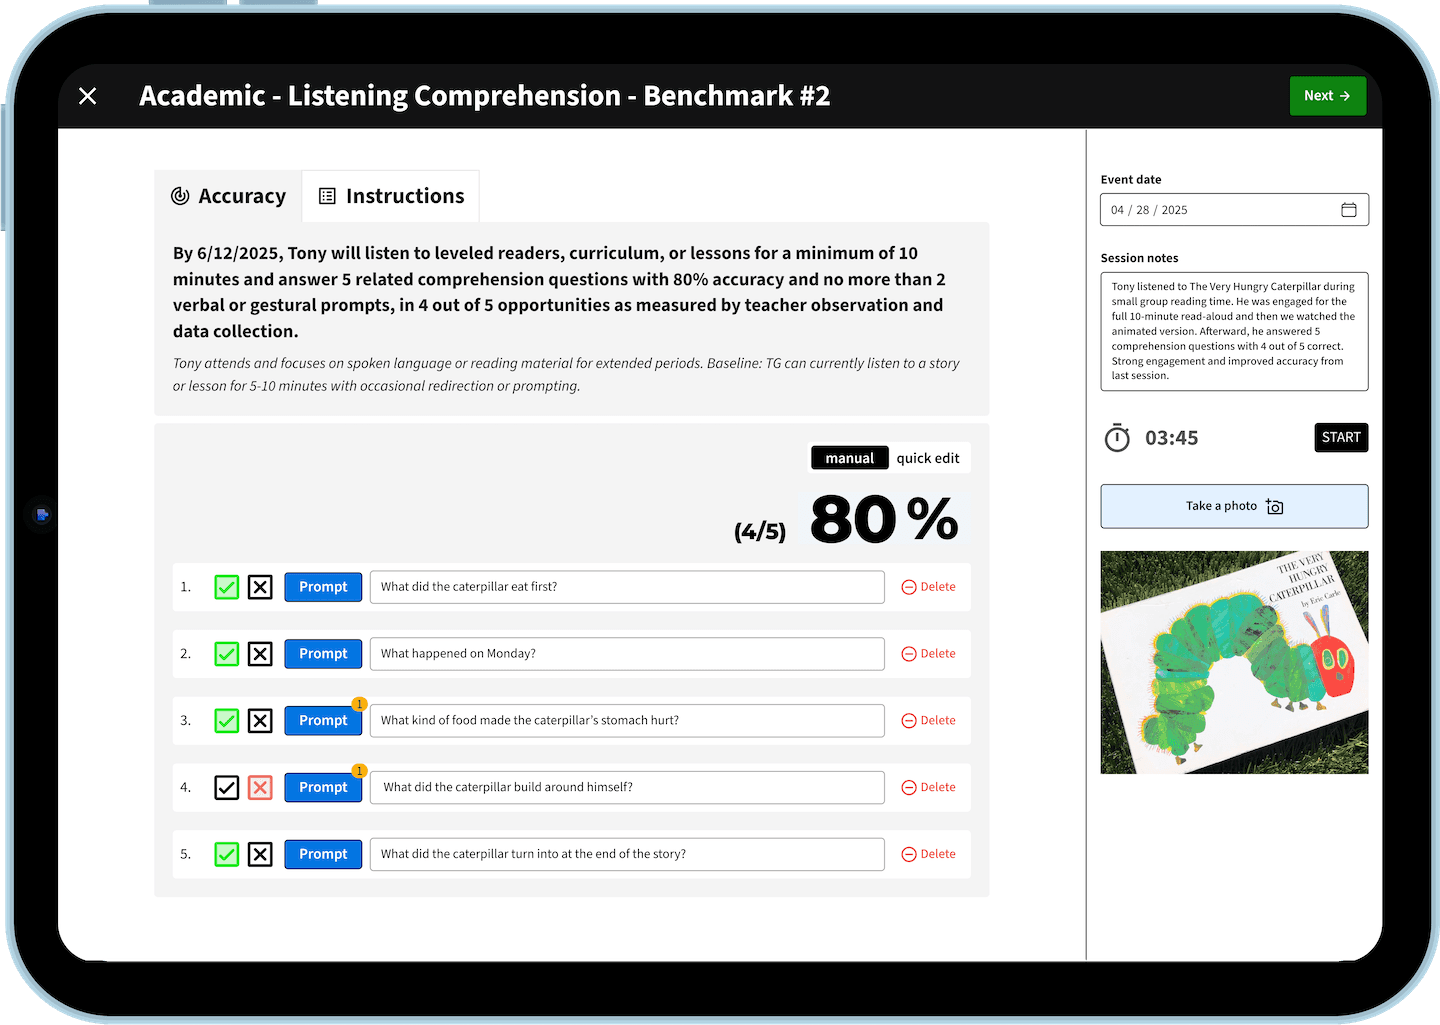
4
Attached Lesson Plan
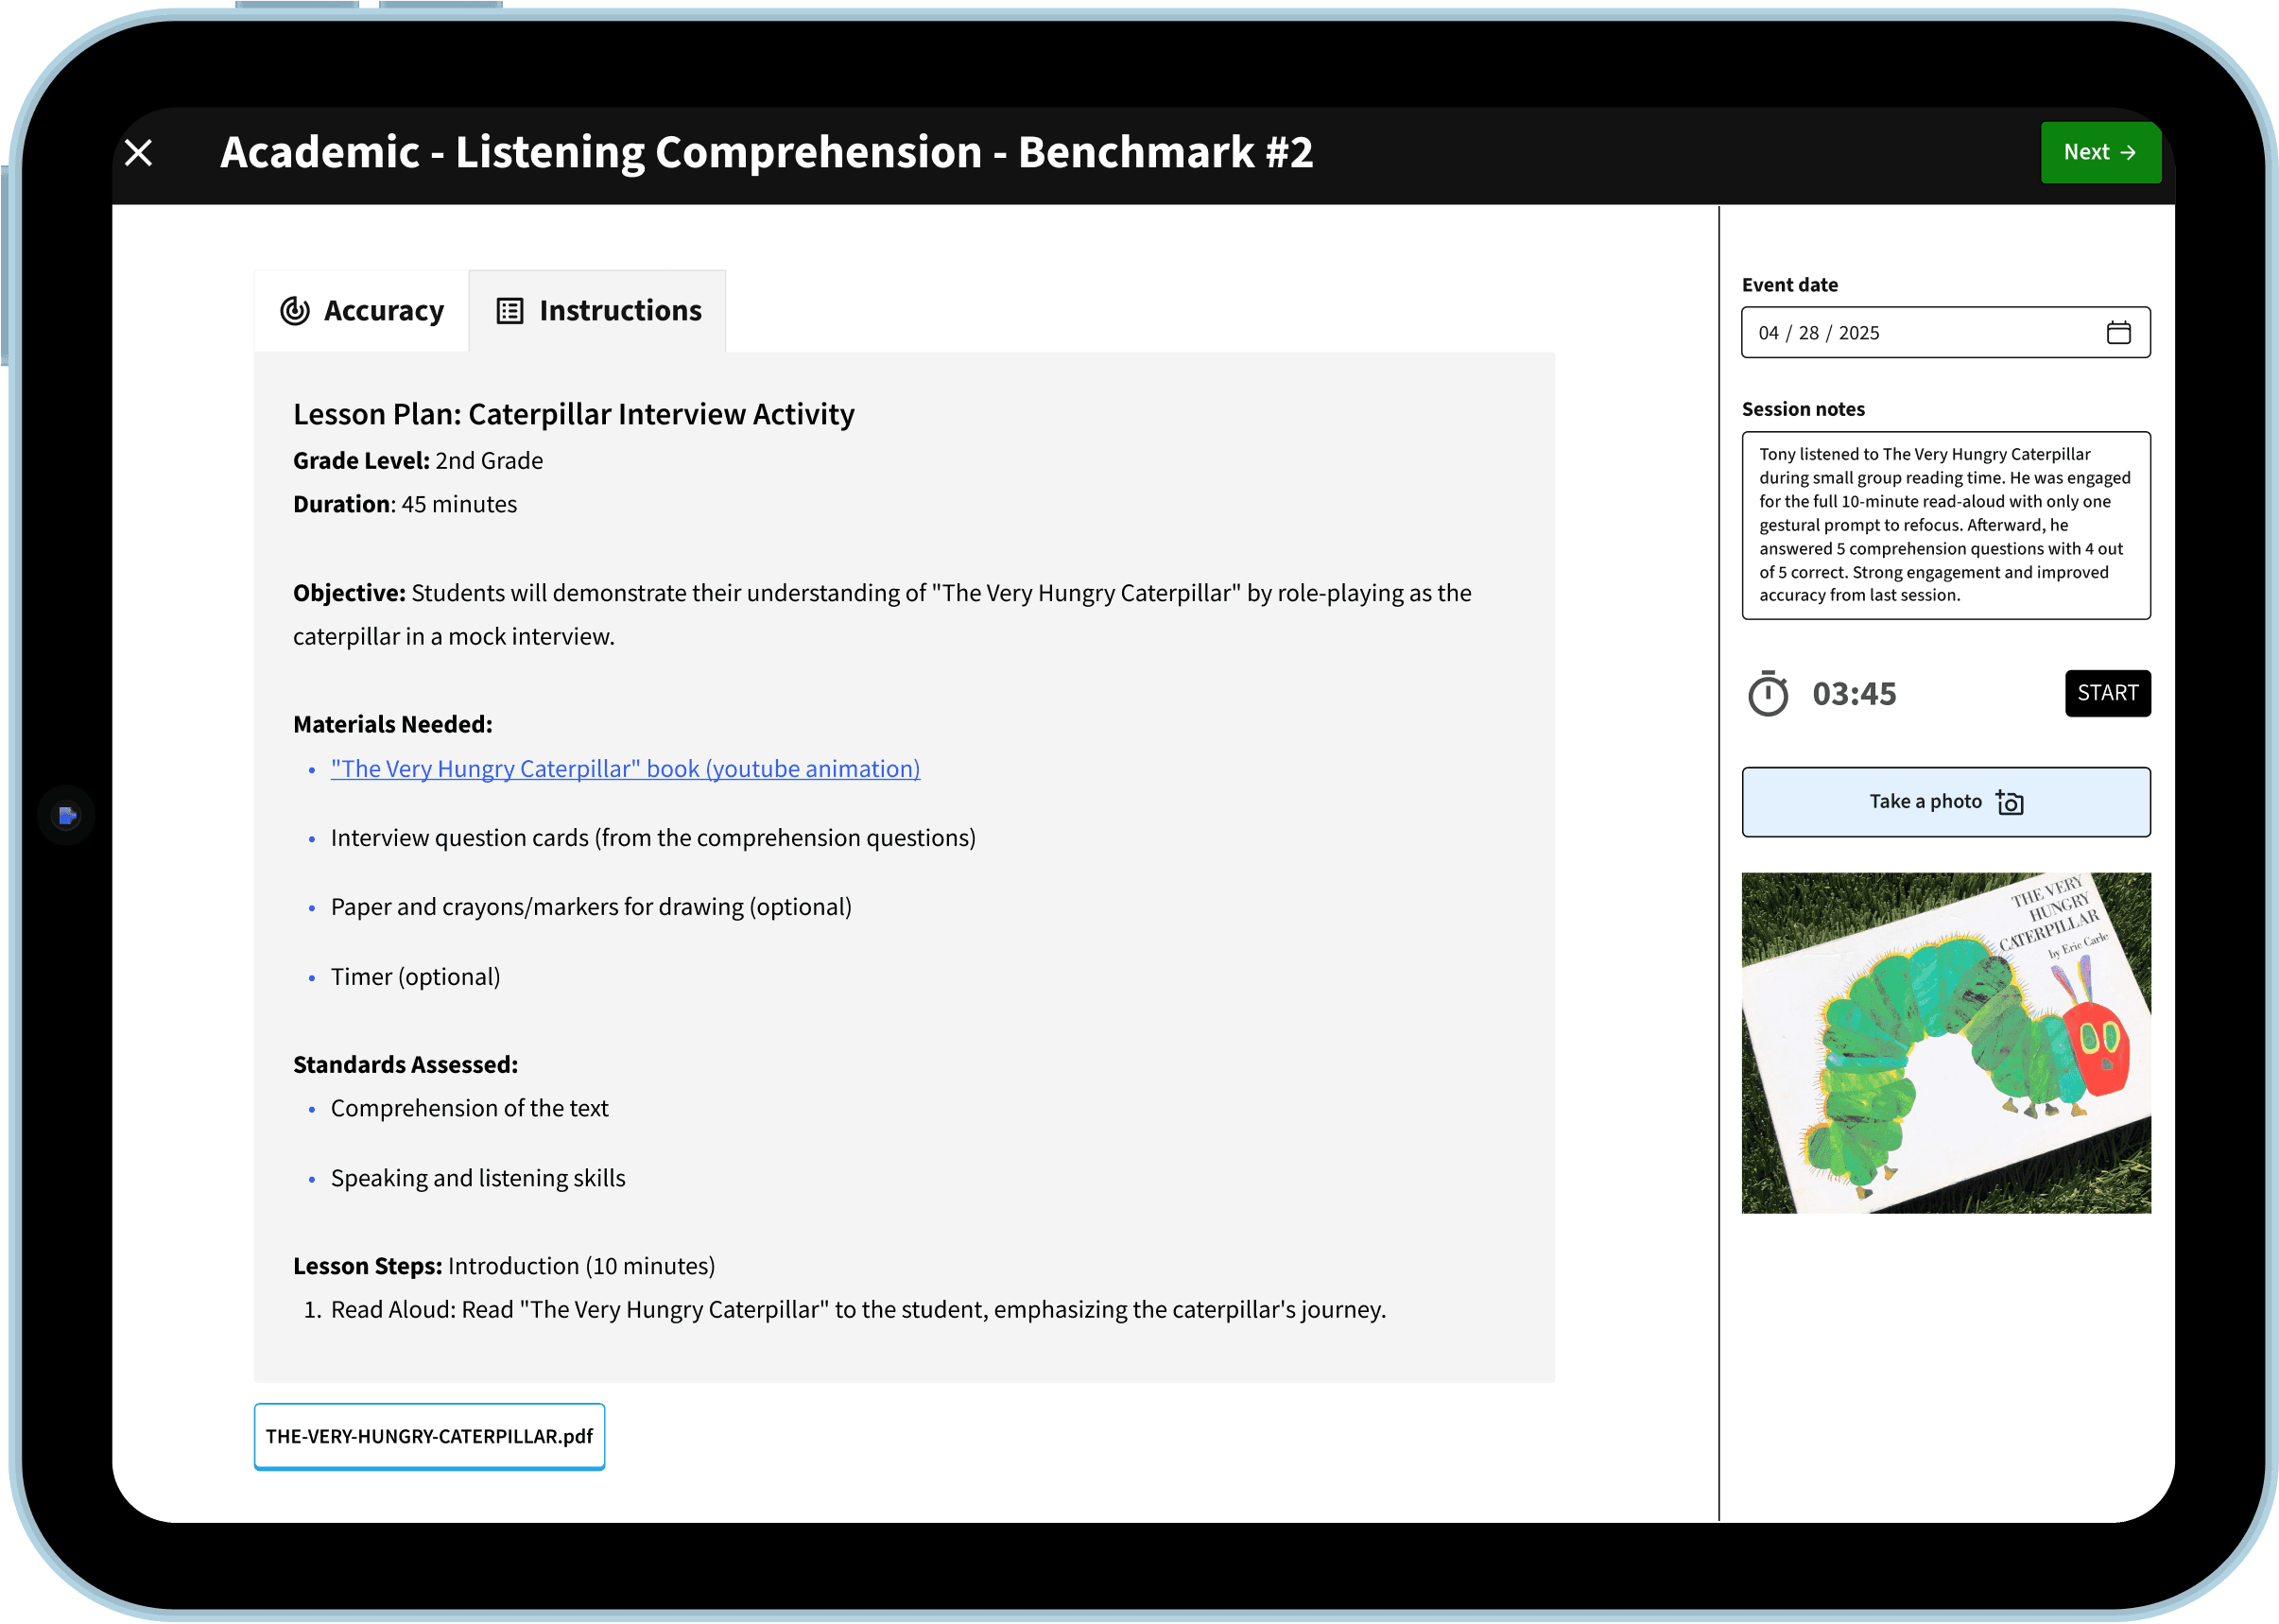
5a
Reports Graph

5b
Reports - Audit data

“I’ve never been super confident with computers, and honestly, I used to get really nervous trying to enter data. But Mela Mela is set up in a way that just makes sense. It’s simple, clear, and easy to use. Now, I can finish my notes without second-guessing inputs on Excel. It’s now a much quicker process.”
— Vivian (Paraprofessional, 3 years experience)
MVP Solution
1
Student Cards
2
Student Dashboard
3
Data Collection
4
Attached Lesson Plan
5a
Reports Graph
5b
Reports Audit Data
1
Student Cards
2
Student Dashboard
3
Data Collection
4
Attached Lesson Plan
5a
Reports Graph
5b
Reports Audit Data
“I’ve never been super confident with computers, and honestly, I used to get really nervous trying to enter data. But Mela Mela is set up in a way that just makes sense. It’s simple, clear, and easy to use. Now, I can finish my notes without second-guessing inputs on Excel. It’s now a much quicker process.”
— Vivian (Paraprofessional, 3 years experience)

MVP+
Standardizing Data Collection for Classroom Teams
Data collection in special education is essential—but rarely easy. This case study explores why consistent, data-driven decisions are so hard to achieve in real classrooms, and how thoughtful design can help close the gap between compliance and daily practice.
Standardizing Data Collection for Classroom Teams
Standardizing Data Collection for Classroom Teams
Data collection in special education is essential—but rarely easy. This case study explores why consistent, data-driven decisions are so hard to achieve in real classrooms, and how thoughtful design can help close the gap between compliance and daily practice.
POST MVP RESEARCH
Innovation Lab - Getting Back Inside the Classroom
We had a functional MVP. It was in the hands of our early adopters but we knew we had to get back inside real classrooms. This is why we created the Mela Mela Innovation Lab. This initiative served two purposes: first, it gave us access to interview, observe, and learn directly from classroom teams in a district setting; second, it opened the door to securing our first district partnership.
*Note: pilot research initiative was implemented before MVP onboarding
Output
1
Teachers: 4 interviews + survey (4 respondents)
Teachers: interviews (4) + survey (4)
2
Paraprofessionals: 6 interviews + survey (26 respondents)
Paraprofessionals: interviews (6) + survey (26)
3
20+ hours of time inside 4 different classrooms
4
Ideation workshop with pilot participants (4 teachers, 6 paraprofessionals)
KEY INSIGHT #1
Method:
Method:
Survey
Takeaway: Administrative overload is a daily reality for teachers. Without support, critical tasks like data collection are often rushed, delayed, or deprioritized. This creates stress and gaps in student support.
Takeaway: Administrative overload is a daily reality for teachers. Without support, critical tasks like data collection are often rushed, delayed, or deprioritized. This creates stress and gaps in student support.
2 hours
Average amount of time spent working on data collection related paperwork per week
Average amount of time spent working on data collection related paperwork per week
75%
Of teachers somewhat or strongly agree, "I am unable to fulfill the duties and responsibilities of my role within contractual hours."
KEY INSIGHT #2
Method:
Method:
Survey
Interviews
Experience Mapping
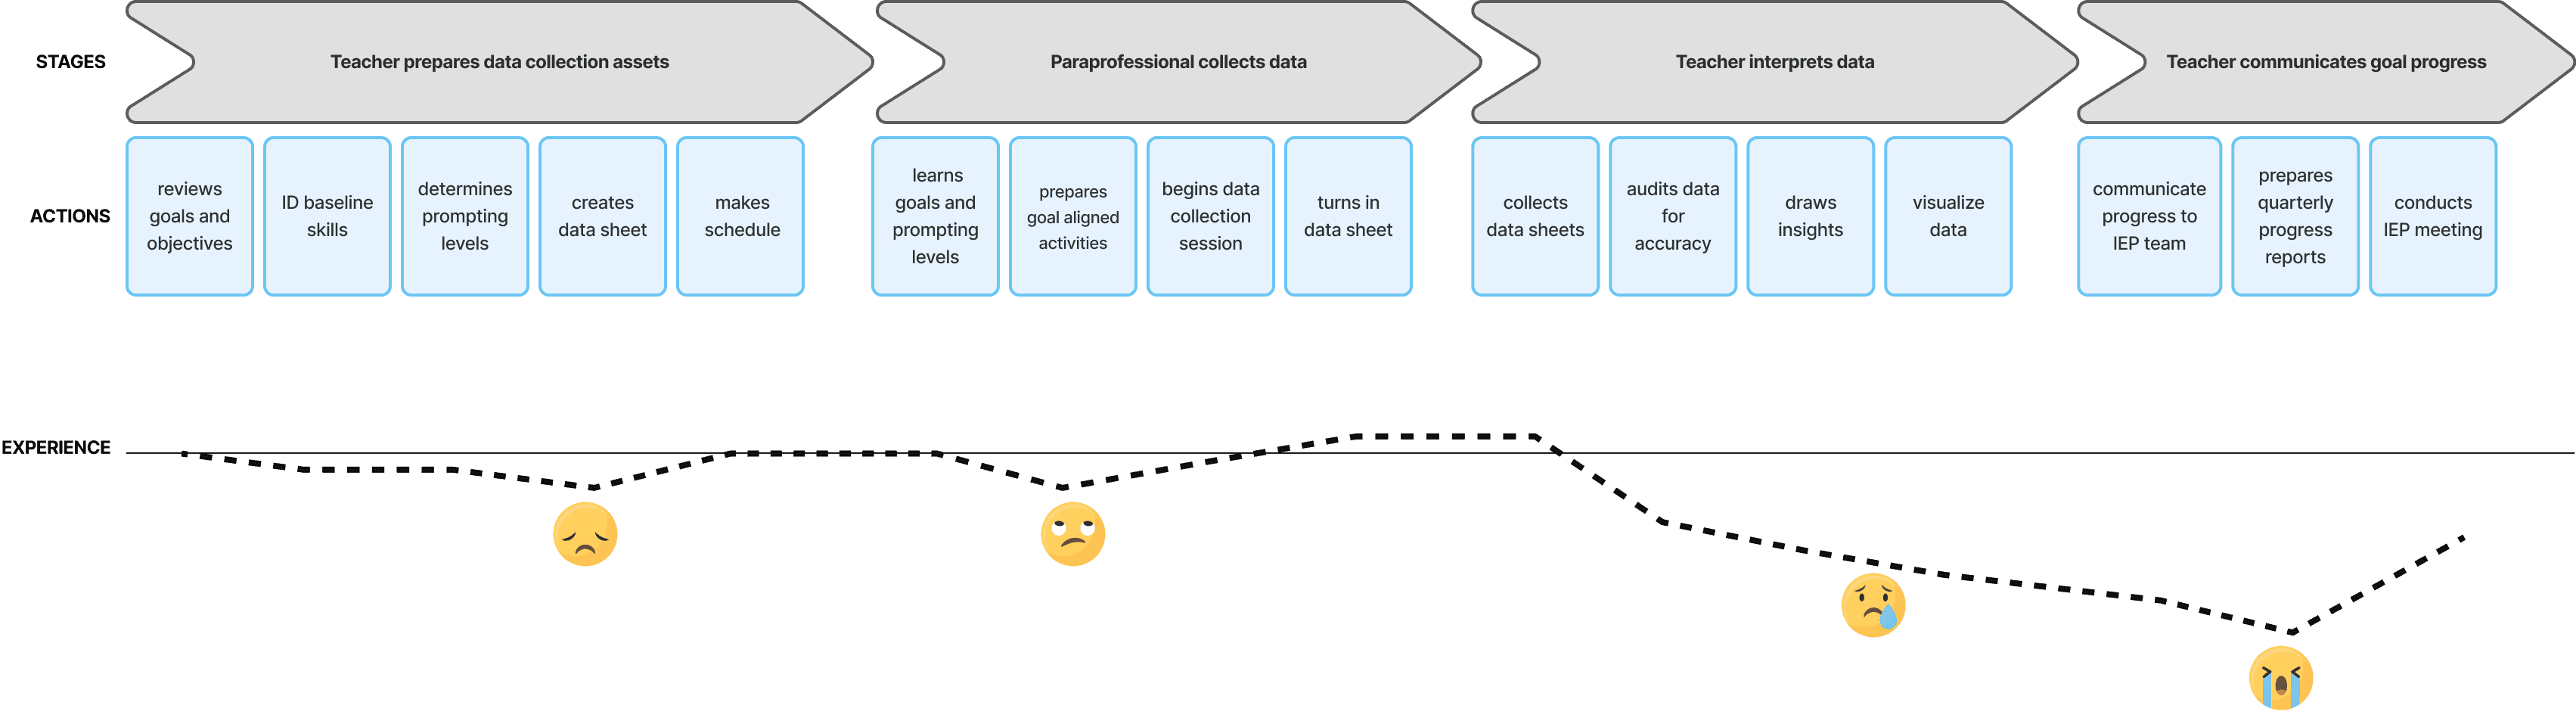
Takeaway: Paraprofessionals collect most of the data, but rarely see how it’s used. Teachers, meanwhile, are left to manually synthesize raw numbers—often too late and with time they don't have. This gap led to a critical realization: by automatically organizing and visualizing data points (something we were already built into our MVP), we were solving turn a major pain point and delivering real value to teachers' data strategy.
Takeaway: Paraprofessionals collect most of the data, but rarely see how it’s used. Teachers, meanwhile, are left to manually synthesize raw numbers—often too late and with time they don't have. This gap led to a critical realization: by automatically organizing and visualizing data points (something we were already built into our MVP), we were solving turn a major pain point and delivering real value to teachers' data strategy.
“Just seeing even the smallest sign that we’re on the right path…even if it’s slow progress. If one student takes three months and another takes one…I'd like to see how the data is being used.”
— JoJo (Paraprofessional, 2 years experience)
“Just seeing even the smallest sign that we’re on the right path…even if it’s slow progress. If one student takes three months and another takes one…I'd like to see how the data is being used.”
— JoJo (Paraprofessional, 2 years experience)
“Just seeing even the smallest sign that we’re on the right path…even if it’s slow progress. If one student takes three months and another takes one…I'd like to see how the data is being used.”
— JoJo (Paraprofessional, 2 years experience)
Supporting evidence: Experience mapping revealed that the most concentrated pain points occurred in the post-data collection phase (when teachers had to make sense and communicate the data collected). Survey responses and interviews confirmed this stage as the most time-consuming and overlooked, highlighting a major opportunity to reduce friction and deliver real time savings.
Supporting evidence: Experience mapping revealed that the most concentrated pain points occurred in the post-data collection phase (when teachers had to make sense and communicate the data collected). Survey responses and interviews confirmed this stage as the most time-consuming and overlooked, highlighting a major opportunity to reduce friction and deliver real time savings.
KEY INSIGHT #3
Method:
Method:
Survey
Interviews
Experience Mapping
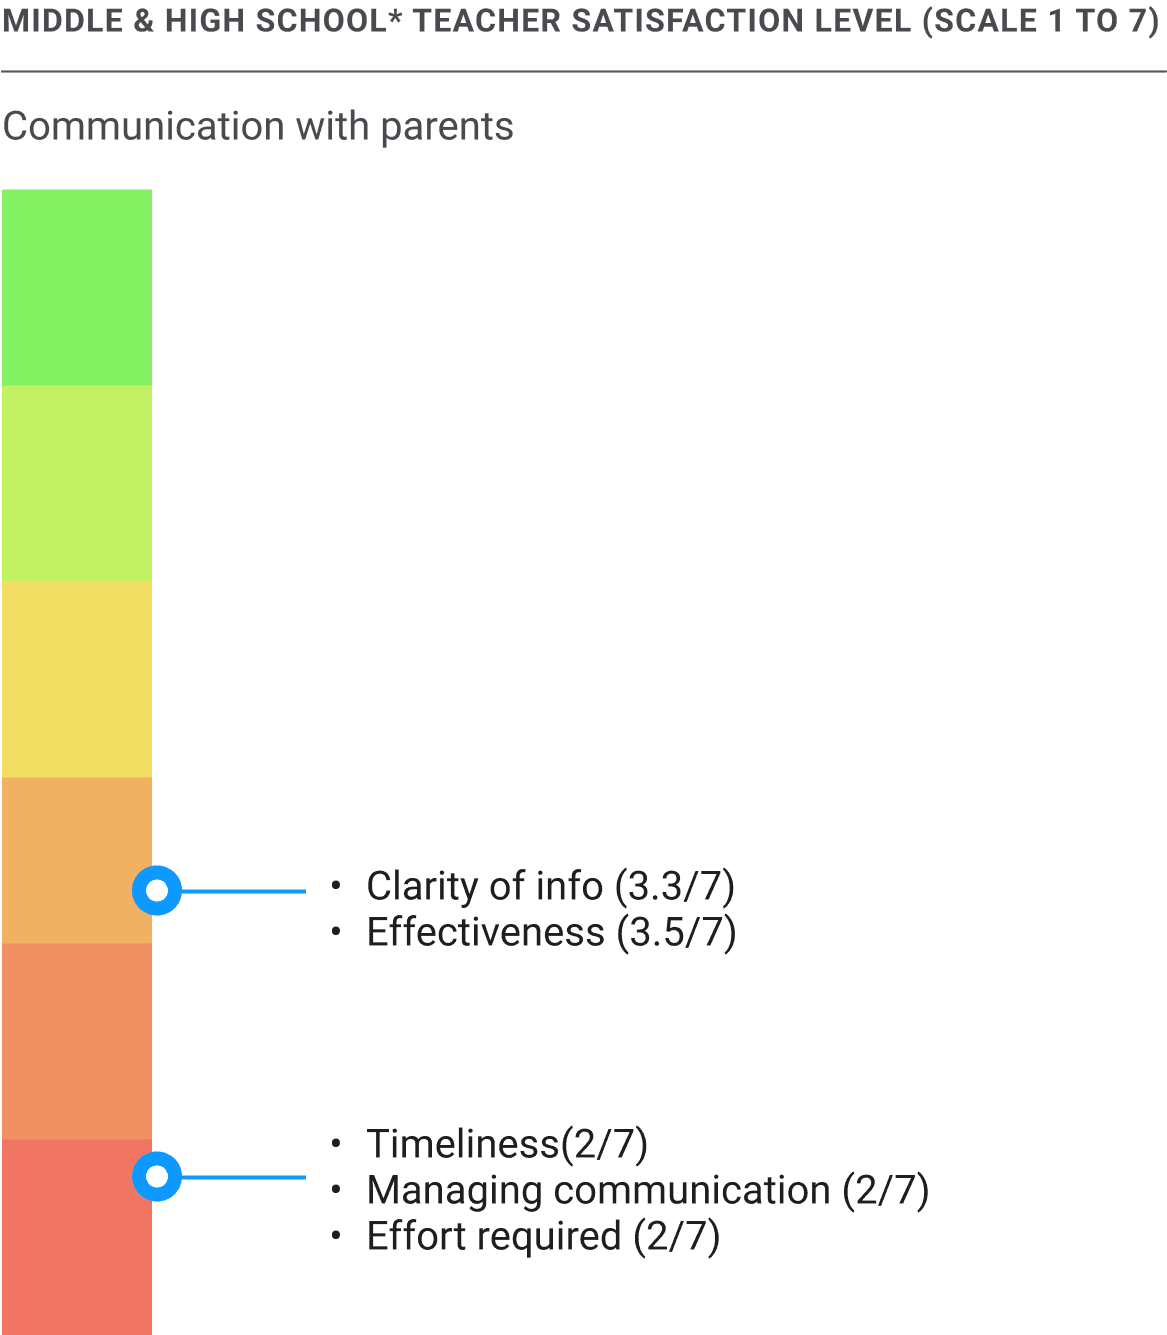
Takeaway: Our research revealed a concerning pattern: teachers averaged just 2 out of 7 across key criteria for communicating with parents about student progress. One contributing factor appears to be the lack of clear, accessible data visualizations. When progress is hard to interpret, communication often drops off, sometimes happening only during annual IEP meetings. While we need additional research to understand the full range of barriers, this finding highlights an important opportunity. Parent communication features are currently outside our MVP scope but are on the product roadmap as a top priority.
Takeaway: Our research revealed a concerning pattern: teachers averaged just 2 out of 7 across key criteria for communicating with parents about student progress. One contributing factor appears to be the lack of clear, accessible data visualizations. When progress is hard to interpret, communication often drops off, sometimes happening only during annual IEP meetings. While we need additional research to understand the full range of barriers, this finding highlights an important opportunity. Parent communication features are currently outside our MVP scope but are on the product roadmap as a top priority.
Retrospective
Similarly to our pre-MVP research, conducting research inside classrooms came with real limitations. Busy environments, limited teacher bandwidth, and constant interruptions made it difficult to gather consistent, high-quality insights.
Fly-on-the-Wall + contextual inquiry revealed pain points that interviews missed and deepened our empathy for educators’ daily challenges.
Combining insights from surveys, interviews, and experience mapping surfaced key pain points and aligned our team. All my team members are new to special education. The experience map became a shared reference grounded in real classroom workflows.
What I would do differently:
Secure funding to interview teachers outside school hours and prioritize access to more diverse classrooms. Both remain challenges in a bootstrapped setting but are key goals for future research.
Execution
Lifting the Blackbox of Data
Lifting the Blackbox of Data
Teachers and paraprofessionals are navigating a system that make continuous and meaningful data-driven insights difficult to to come by. This isn't anyone's fault. Synthesizing raw data takes time, and most educators simply don't have it.
We saw an opportunity to flip that dynamic. By automatically synthesizing imported data into teacher-centered graphs and tables, we shifted the burden off educators and onto the system. What once took hours or was never done at all became available instantly. Insight was no longer a occasional event. It was now accessible any day of the week.
Output
1
Get product in the hands of 18 new users
2
Ship additional data visualization table feature
5c
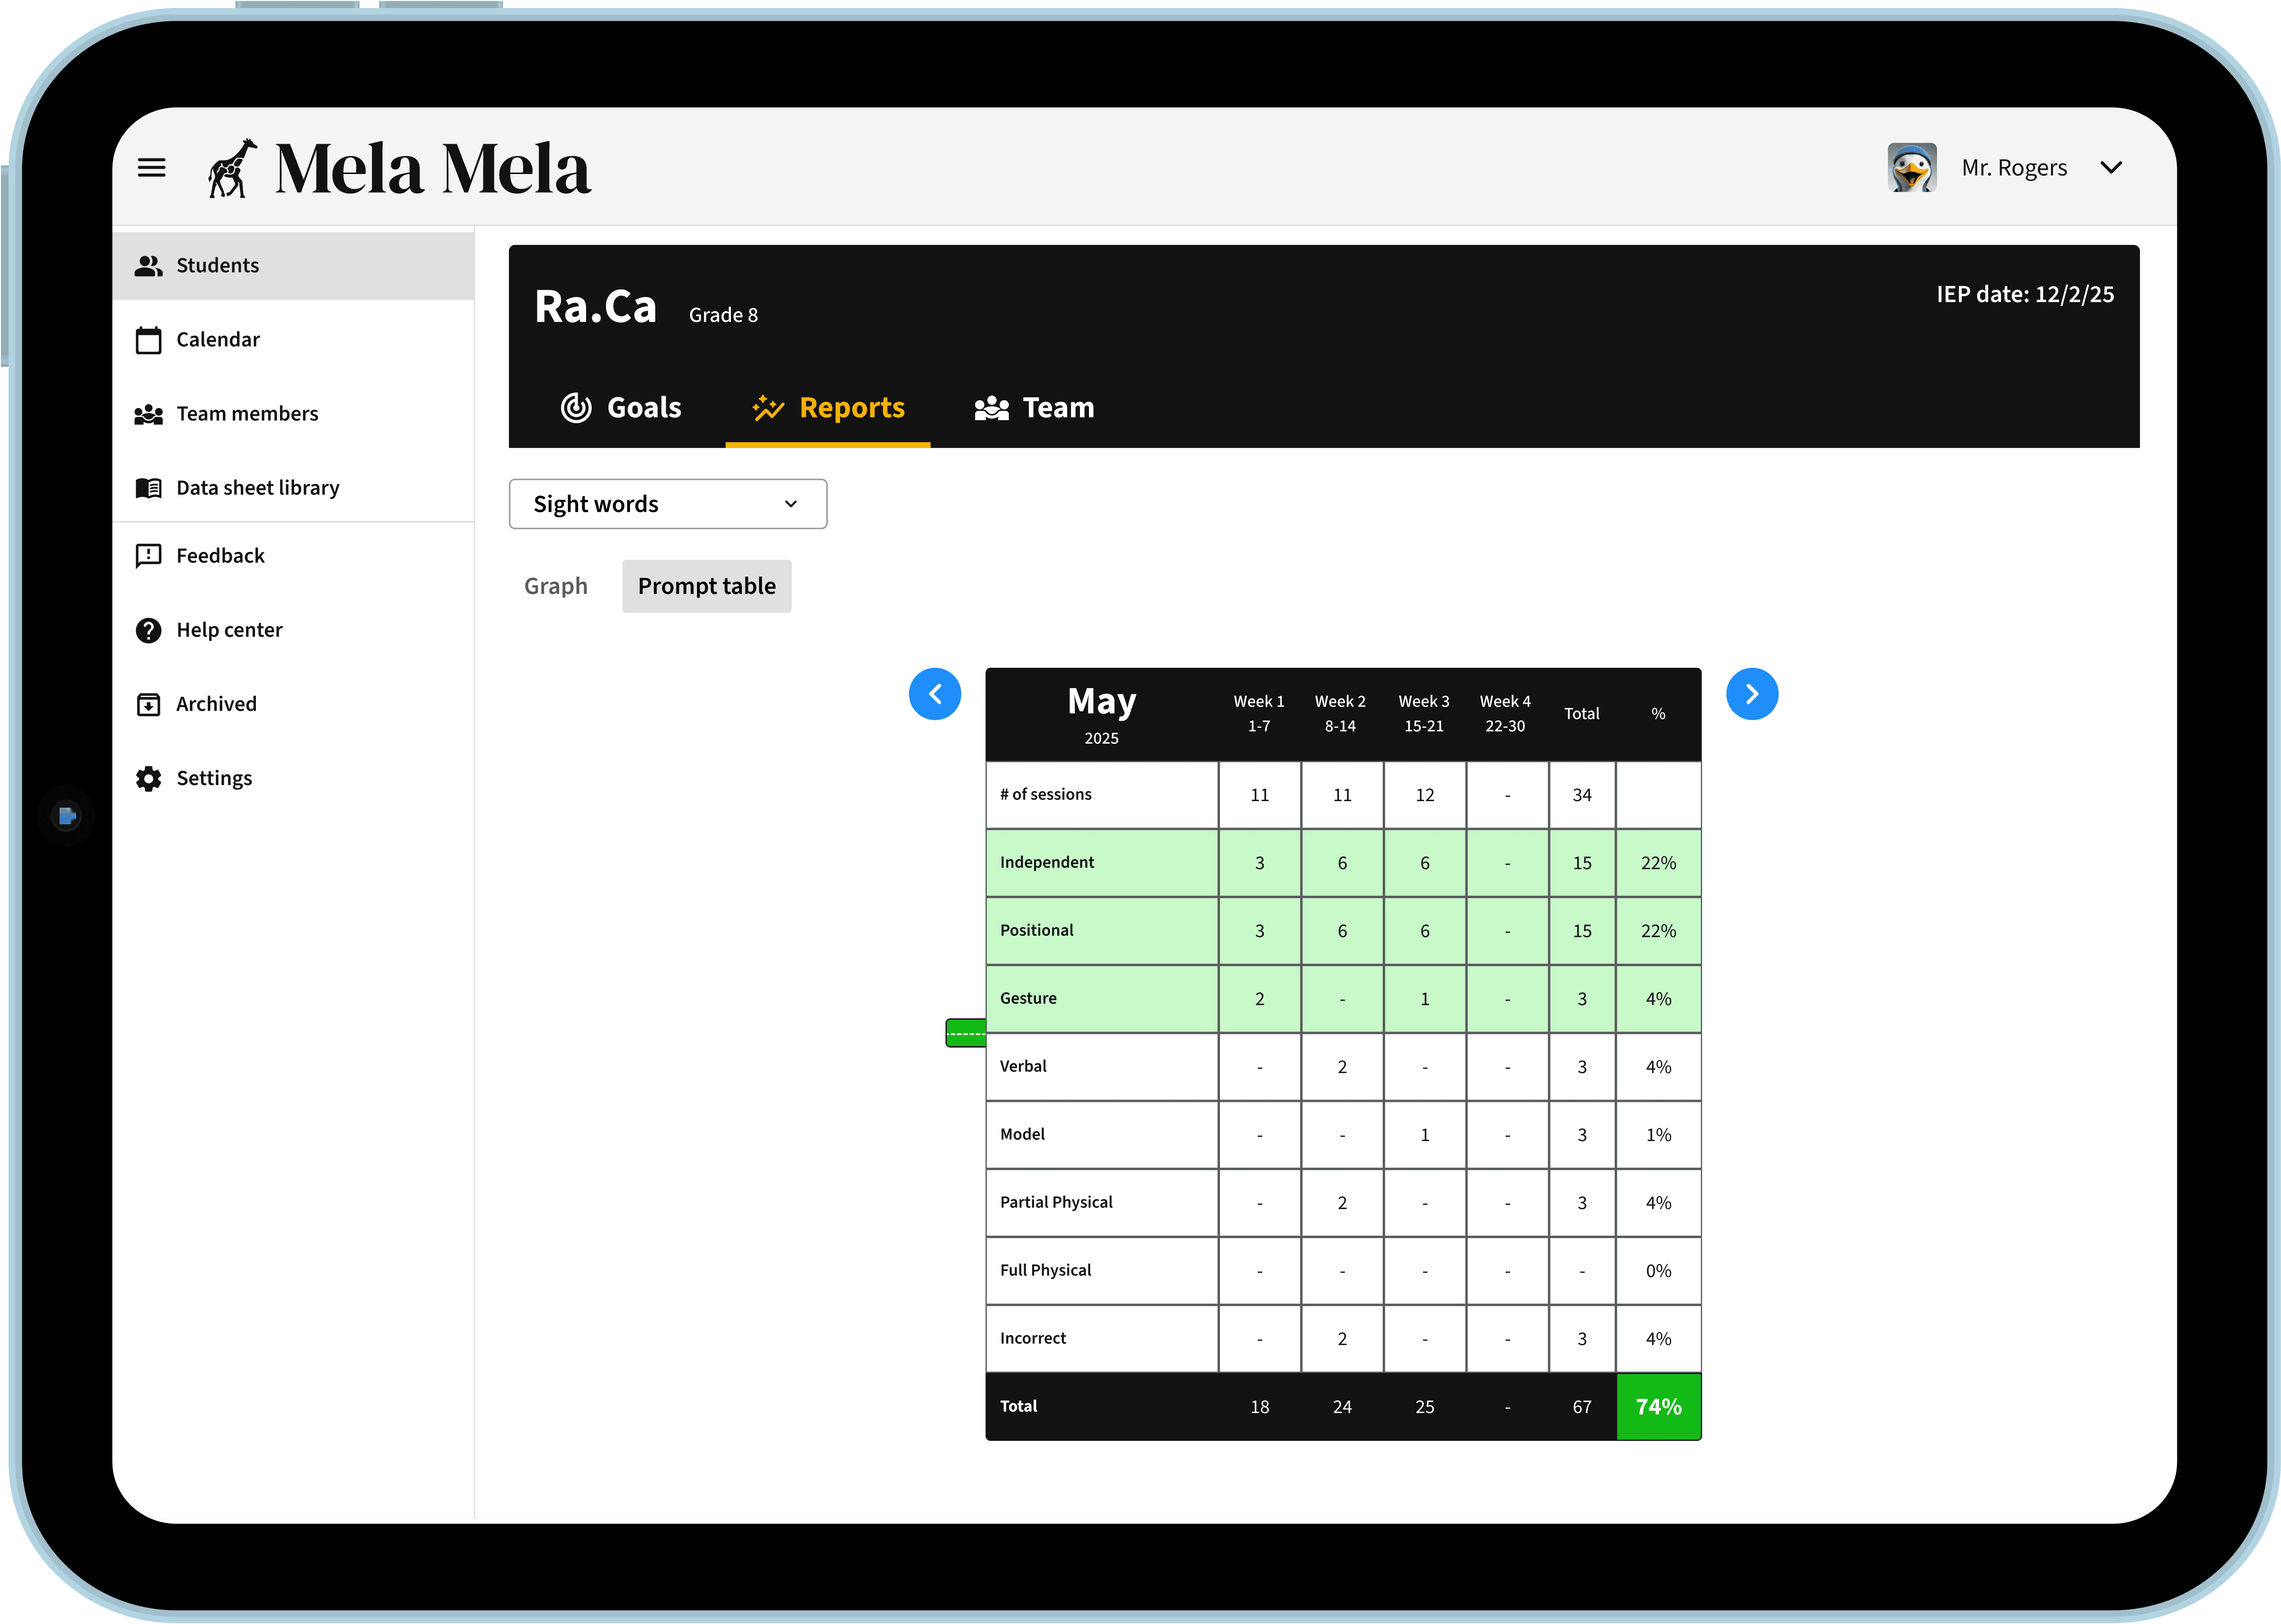
Reports - Prompt table
With our innovative Prompting Hierarchies Table, we give educators a structured, visual way to understand how students are receiving support in real-time.
5c
Reports - Prompt table
With our innovative Prompting Hierarchies Table, we give educators a structured, visual way to understand how students are receiving support in real-time.
5c
Reports - Prompt table
With our innovative Prompting Hierarchies Table, we give educators a structured, visual way to understand how students are receiving support in real-time.
"I can see the progress as the teacher. What my students are understanding, what they’re not, and it’s easier to talk to parents about it. You know, a month from now to sit down and be like how did this happen? When did this happen? Where did this happen?"
— Courtney (Teacher, 2 years experience)
"I can see the progress as the teacher. What my students are understanding, what they’re not, and it’s easier to talk to parents about it. You know, a month from now to sit down and be like how did this happen? When did this happen? Where did this happen?"
— Courtney (Teacher, 2 years experience)
"I can see the progress as the teacher. What my students are understanding, what they’re not, and it’s easier to talk to parents about it. You know, a month from now to sit down and be like how did this happen? When did this happen? Where did this happen?"
— Courtney (Teacher, 2 years experience)
Outcomes
📈
We saw a 95% reduction in time spent synthesizing data, along with faster time to value through clearer data visibility and more consistent, data-driven communication among classroom teams.
📈
Pilot teachers report Mela Mela is saving them 30 minutes per student for each quarterly reporting period. For a teacher with an average of 12 students on their caseload and a pay rate of $30/hour, that’s 24 hours saved annually = $720 in recovered time value per teacher, per year.
📈
Average of 600 submitted data collection events per month January - March 25'.
Business Impact
💥
Time savings offers clear ROI to districts—saving average classrooms $720 of recovered labor per teacher annually, and a more sustainable model for retaining educators (losing a single 1-year teacher costs districts $7-25K). In addition, Mela Mela’s focus on shared responsibilities lighten the load for teachers and also open us up for larger addressable market.
💥
Increased revenue with our first district pilot, converting early users into our first paying customers.
Reflection
What This Project Taught Me
This was my first real design project. It changed my life. What began as a conceptual design assignment turned into a live product, a real mission, and a crash course in what it means to be a leader and design for impact. It marked the beginning of my career in product design. Here are my high-level reflections I will take with me into my next role:
Impact on me: I stepped into product management alongside design, learning to align user needs and product metrics with business goals and communicate clearly across my team sharpened my ability to drive strategy while keeping everyone on the same page.
Impact on my process: Explicitly documenting user needs gave me confidence when collaborating with my engineers. Involving them early led to our most innovative work. Design is just pixels in Figma until engineers bring it to life. I saw firsthand how clear, early collaboration directly improved outcomes and user experience.
Beyond the Status Quo
Data collection is one of those tasks that quietly piles up until it becomes overwhelming. There’s no signal or red flag warning. It wears teachers down silently, leaving gaps in communication and is a factor that slowly pushes them toward burnout.
In special education, this is part of a larger, more troubling pattern — what some describe as a million paper cuts. No single task breaks a teacher. It’s the accumulation of responsibilities that feel minor in isolation but unmanageable in total: tracking goals, managing behavior, managing staff, writing reports, preparing lesson plans — all while teaching, caring, and responding in real time to high-needs students.
When systems don’t support this complexity, teachers are forced to choose between staying afloat or staying compliant. Most choose survival. Essential duties slip by. And who could blame them?
These slow-burning stressors lead to burnout, anxiety around their role, and ultimately, early exits from the profession. The consequences ripple outward to students, families, and schools, compounding year after year.
This is the gap Mela Mela is working to address. Not to “fix” teaching, but to ease the weight where it’s heaviest. To support educators with product decisions grounded in empathy and efficiency.