
Standardizing Digital Data Collection
In special education, data collection is not optional — it’s a legal mandate. Under the Individuals with Disabilities Education Act (IDEA), schools must track and report student progress on Individualized Education Program (IEP) goals to remain compliant. But beyond compliance, data collection supports decision-making in the classroom, supports communication with families, and ensures that students receive the specific support they need.
THE PROBLEM
When Systems Fail the Classroom
Imagine you’re a special education teacher preparing for an IEP meeting. You’re expected to report on student progress, but all you have are scattered notes and what you can remember from the past months. The anxiety builds. You care deeply, but the task feels unrealistic. You start to worry about the families you support and whether you’re giving them what they deserve.
This is the daily reality for many teachers. Without clear systems, data gets buried, communication breaks down, and districts face real consequences.
⚠️
Unrealistic Expectations: The volume of goals teachers are required to manage can be high. Depending on the classroom type, goals across the school year can range from 50 - 200+.
⚠️
Rising Legal Risk: Some districts spend hundreds of thousands each year resolving special education disputes that often stem from poor documentation.
⚠️
Community Fallout: When districts fail to meet compliance, trust breaks down. Teachers burn out, families grow discouraged, and the sense of partnership between home and school weakens.
PRE-MVP RESEARCH
Listen to the People Doing the Work
Output
1
12 teacher interviews & surveys across 4 different school districts
2
Paper-based data collection audit
3
Competitive analysis
Key Learnings
📈
83% of teachers use paper-based system
How do you organize your data collection system?

“I don't have data sheets for every goal, I feel really horrible about it."
Olga (Special Education Teacher, 1st year)
📈
75% of teachers spend 2+ hours a week on administrative data collection related tasks
"It takes a lot of time and energy to develop activities and then communicate expectations so paraprofessionals can take data. The data sheets need to be ready and the activity has to match the goal and I sometimes need to teach the paraprofessionals how to take data on that goal."
Mario (Special Education Teacher, 2nd year)
Understanding the Status Quo
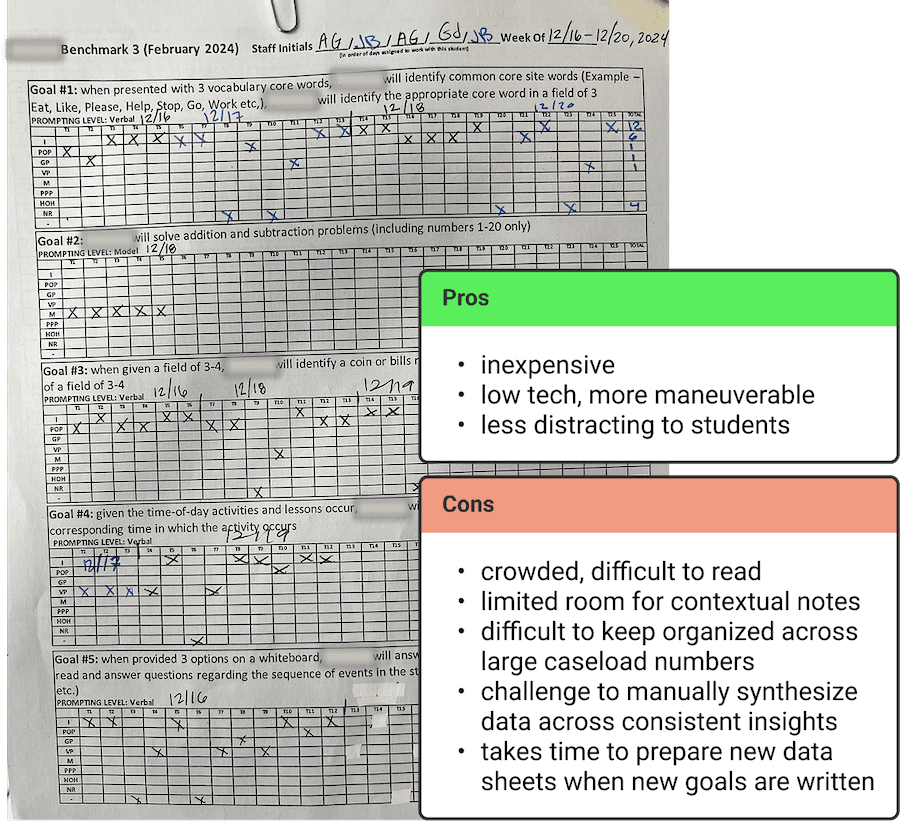
My strategy was to analyze paper-based workflows, which remain the most common approach across districts, and identify where they fall short.
Below is one of the more comprehensive and organized versions I encountered. Even at its best, this system revealed several friction points and clear opportunities for improvement.
COMPETITIVE ANALYSIS + SURVEY
Impressive, Robust…but Overbuilt?
I noticed many competitor platforms offer a wide set of data collection types. While impressive, my instincts told me to focus my efforts on the most used methods.
This insight, combined with a simple teacher survey, helped sharpen my focus. Accuracy and task analysis stood out as the most commonly used data collection methods.
What types of data collection methods do you use in your classroom?

“How might we reimagine a digital experience that elevates classroom pain points and aligns with current educator workflows and mental models?”
GOAL
To equip every classroom team member with the tools they need to consistently and meaningfully contribute to the data collection process.
INDICATORS OF SUCCESS
1
Reduce time spent on administrative tasks
Streamline workflows so teachers work faster, stay organized, and save time.
2
Increase time to value
Give teachers immediate, easily digestible insights to submitted data sessions.
3
Paraprofessional participation
Shared responsibilities lighten the load for teacher.
4
Submitted sessions = north star metric
Submitted data collection events indicate classroom engagement and usability.
SOLUTION
Introducing Mela Mela's Standardized Data Collection method — a simplified, modern approach to documenting student goal progress. Our platform gives cross-functional teams shared student awareness, intuitive data collection tools, and instant access to student reports.
0.1 — Student Cards
It all starts at Student Cards. These "digital student binders" are simple, organized and ready for team participation.
1) Each student has their own card 2) reports tab takes administrators directly to graphs and tables for instant insights (view 0.6 & 0.7).

0.2 — Student Dashboard
You can think of this screen as the student hub — housing everything for an individual student:
1) goal organized and sorted by benchmark objective 2) associated team members only see the goals they are assigned 3) set/view calendar and lesson plans 4) "Track data" takes users directly to a data collection session 5) reports tab gives administrators instant insight to all submitted data.

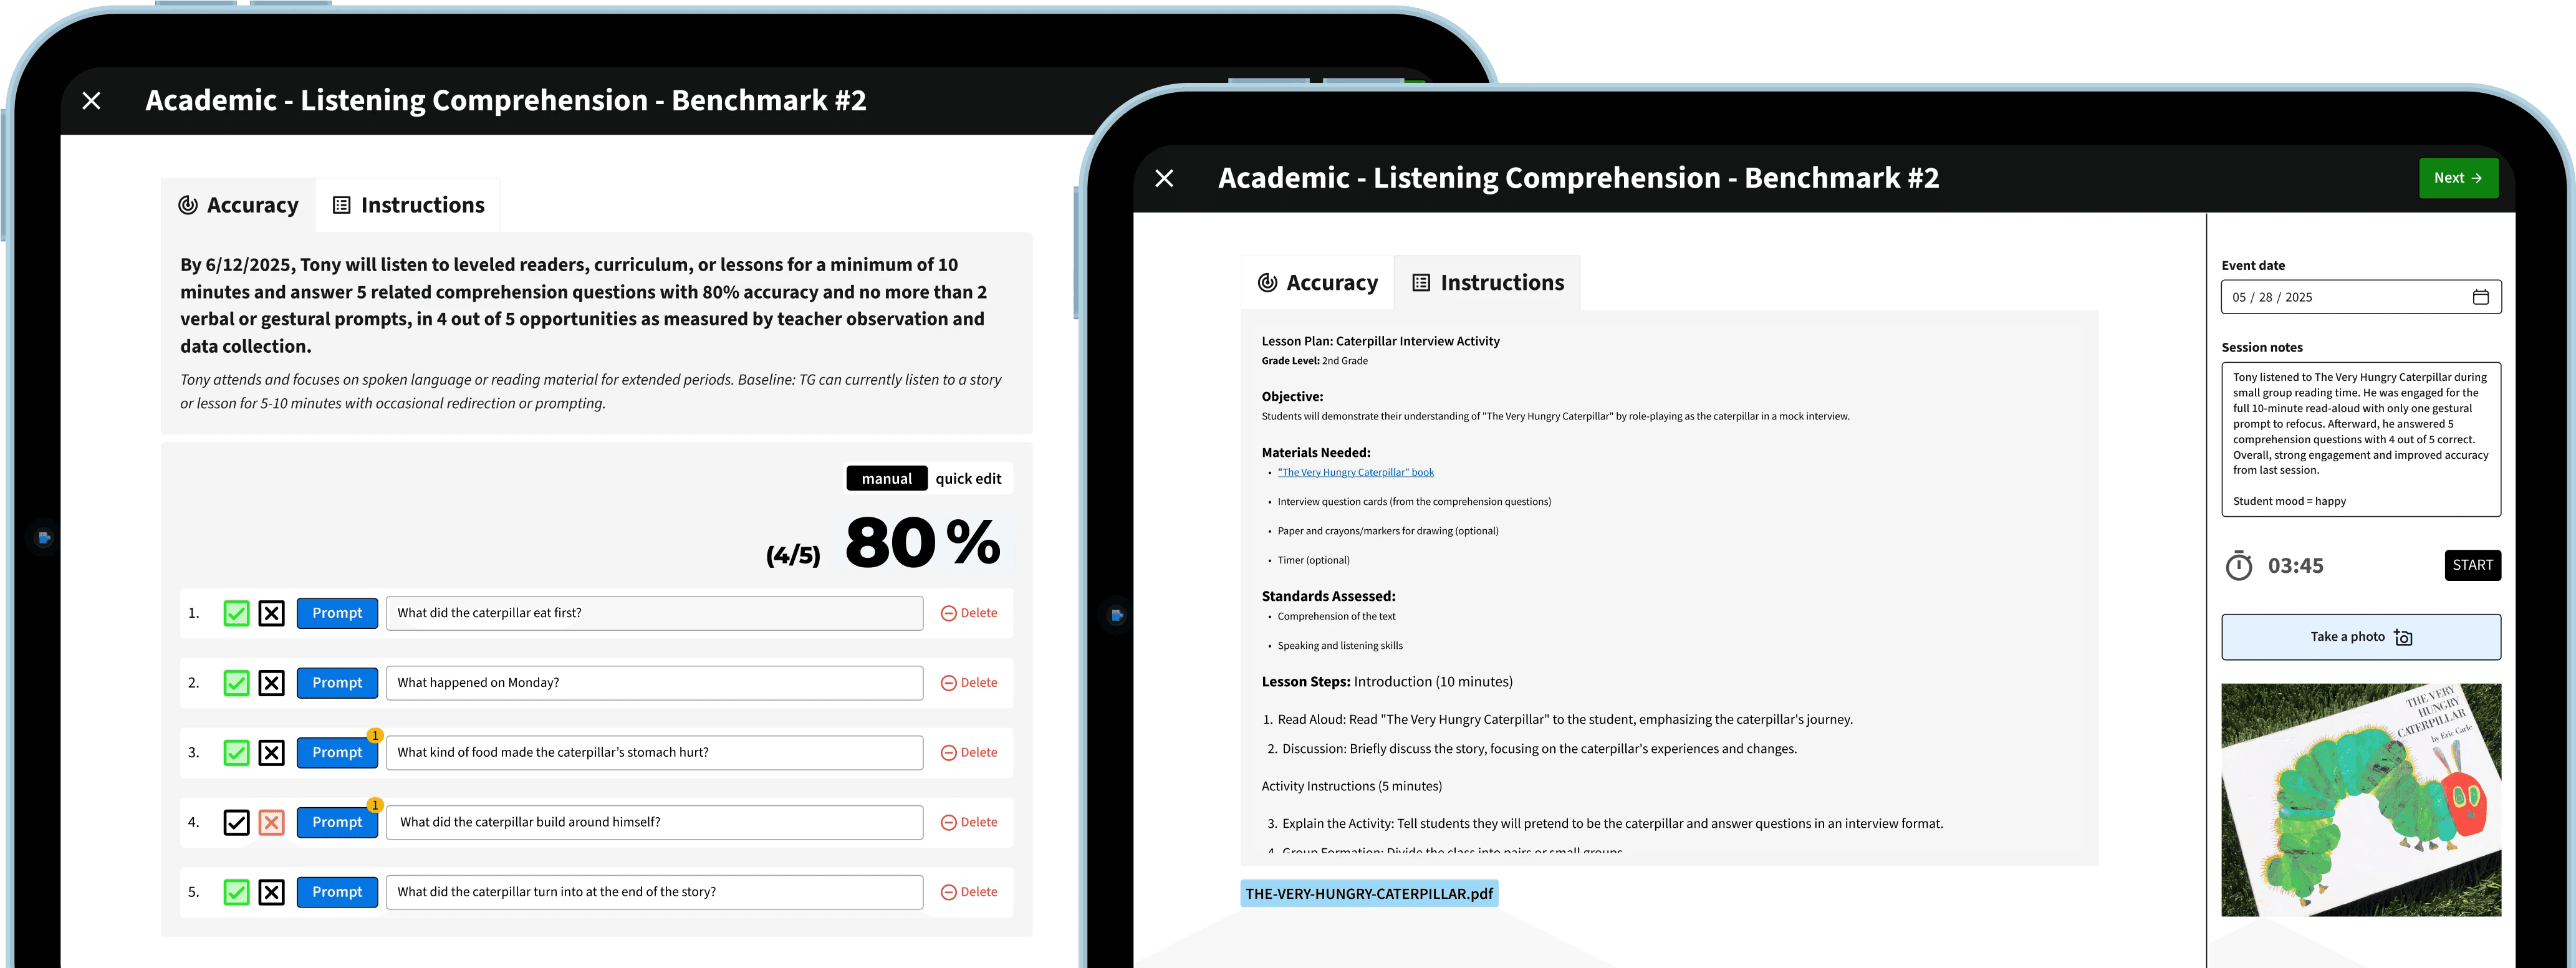
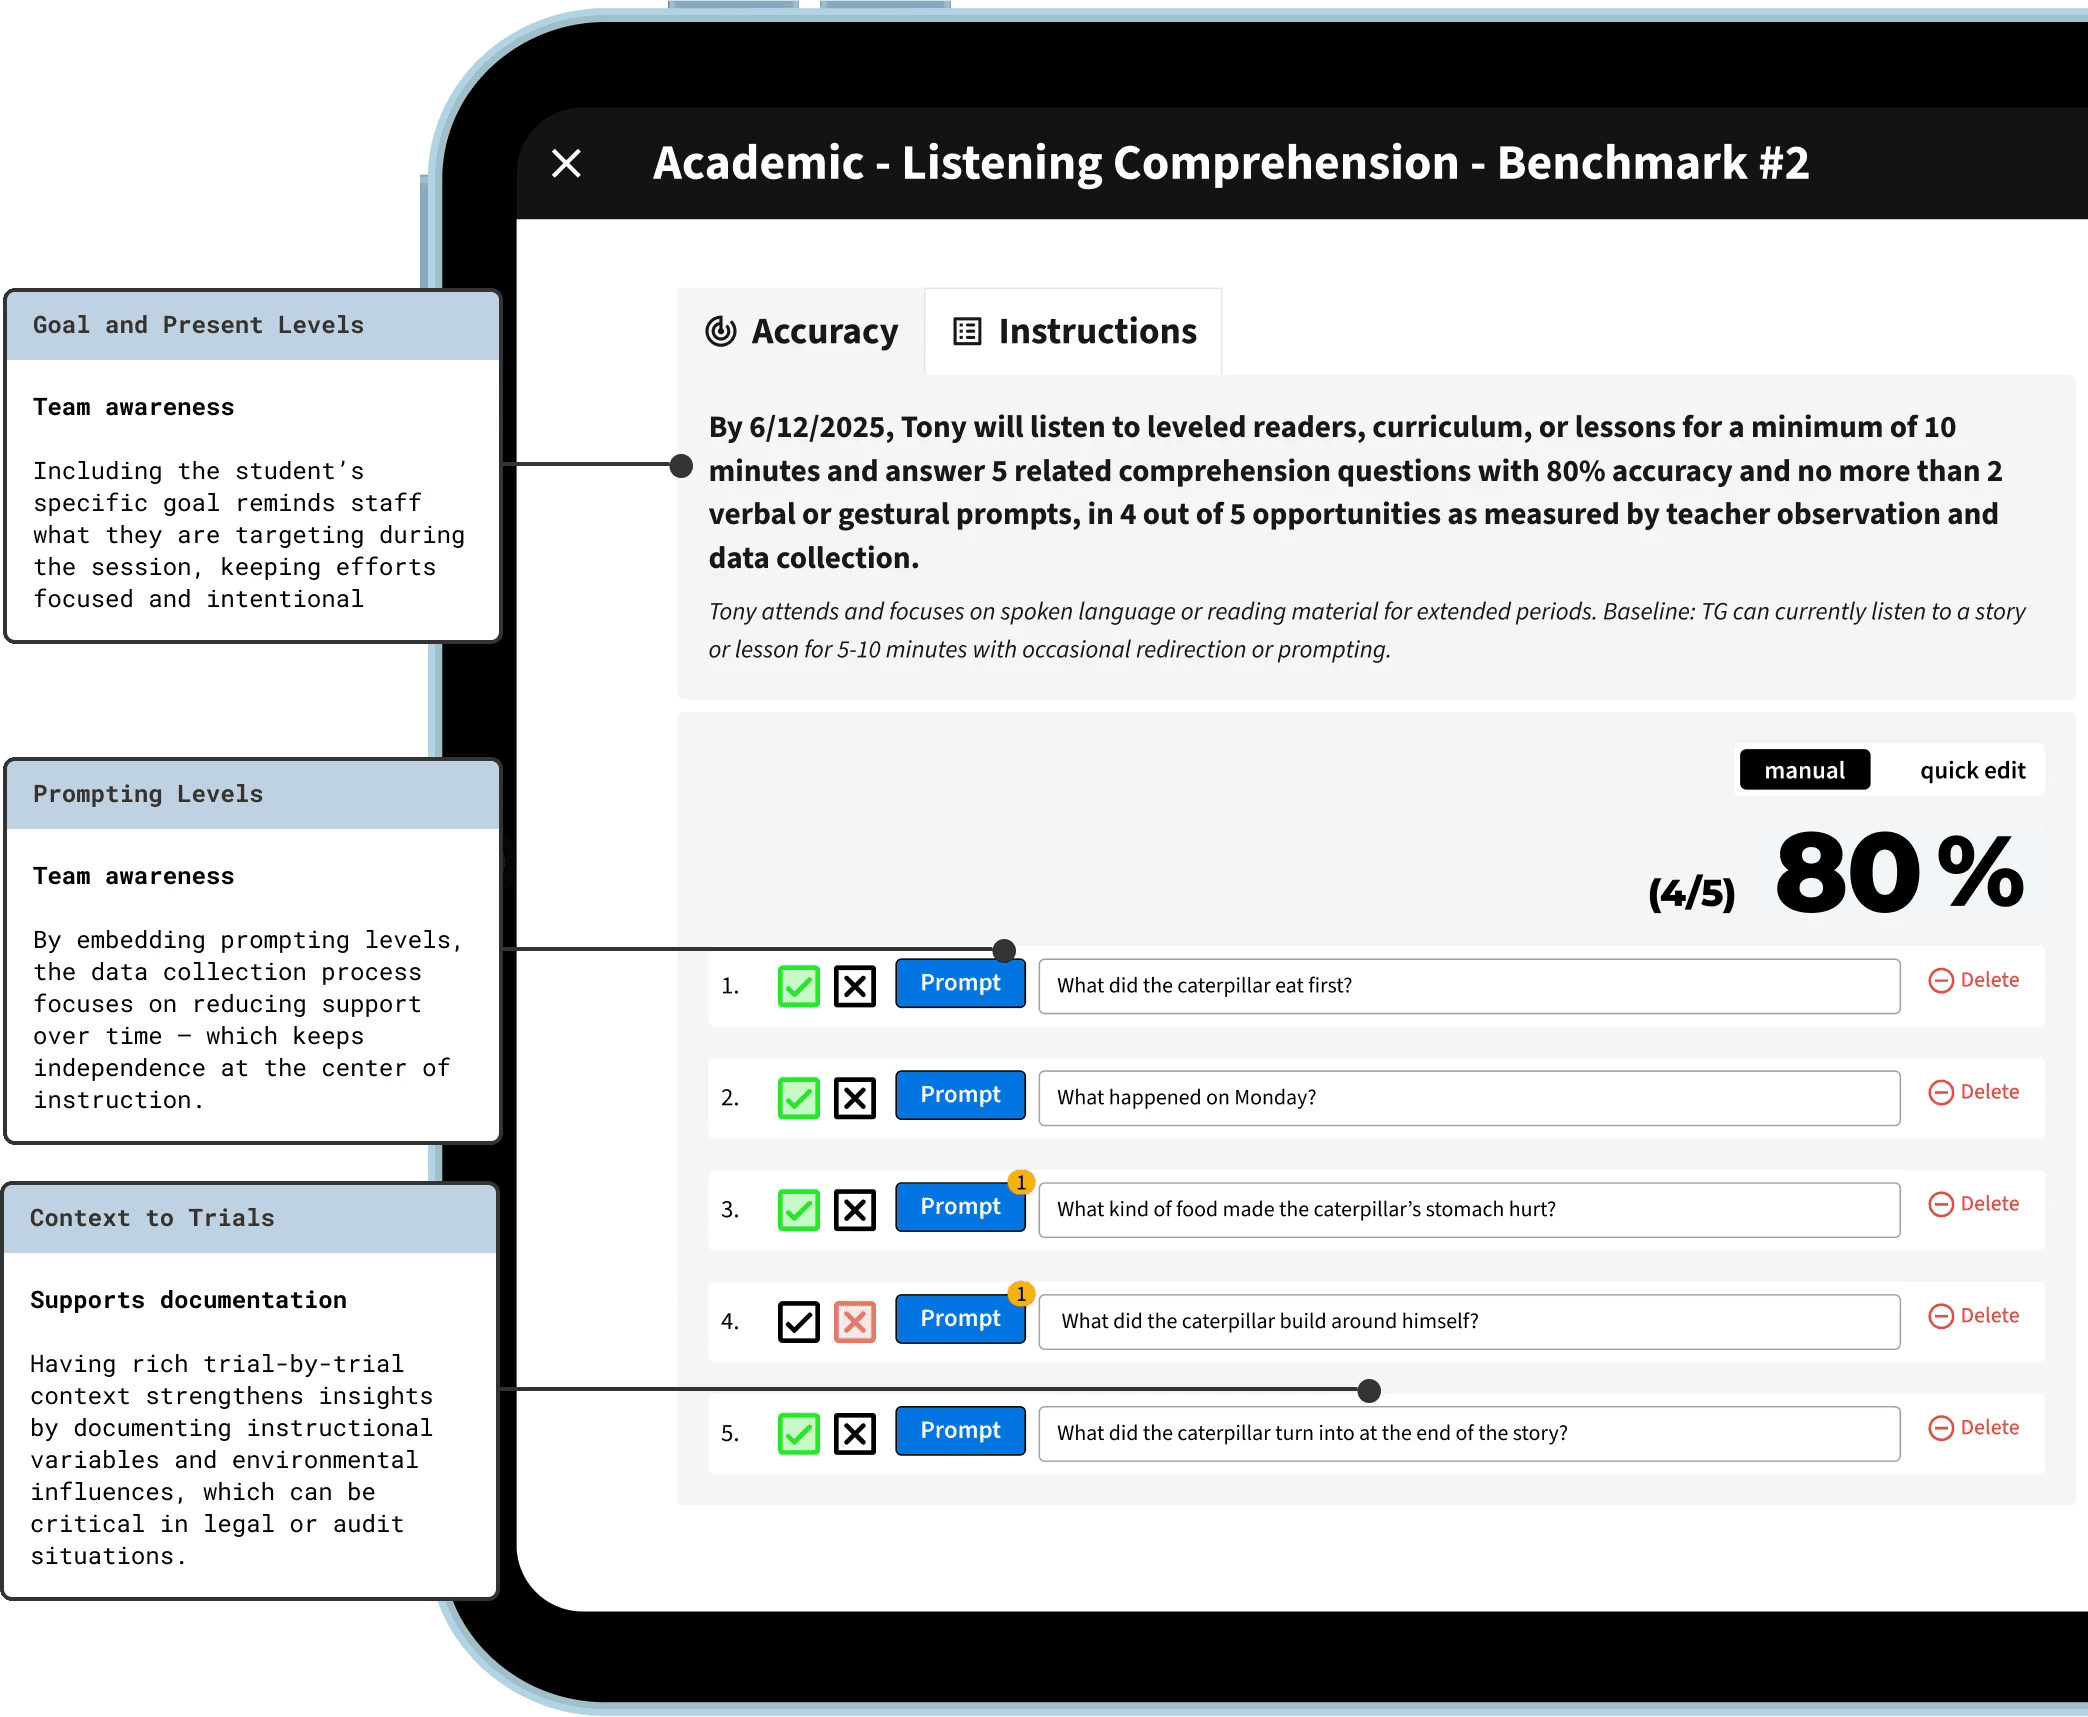
0.5 — Data Collection Interface - Accuracy Style
0.4 — Data Collection Interface - Right side tool bar

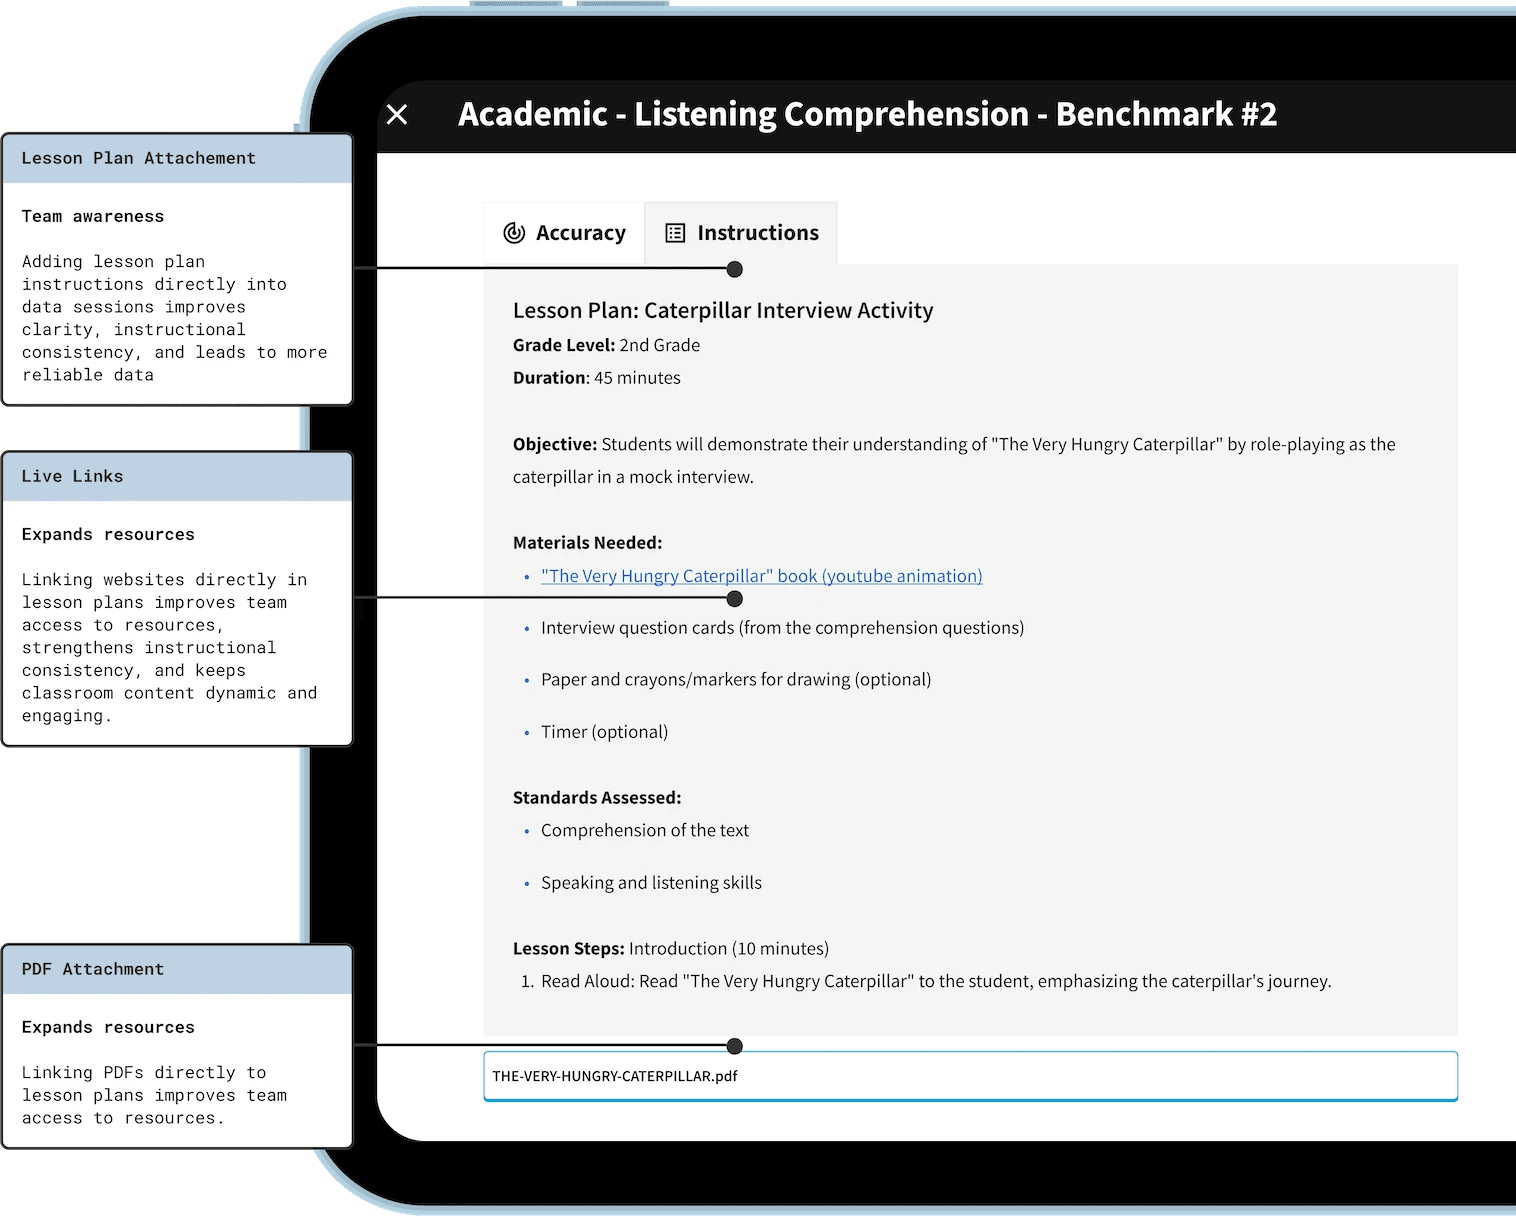
0.3 — Data Collection Interface - Instructions tab
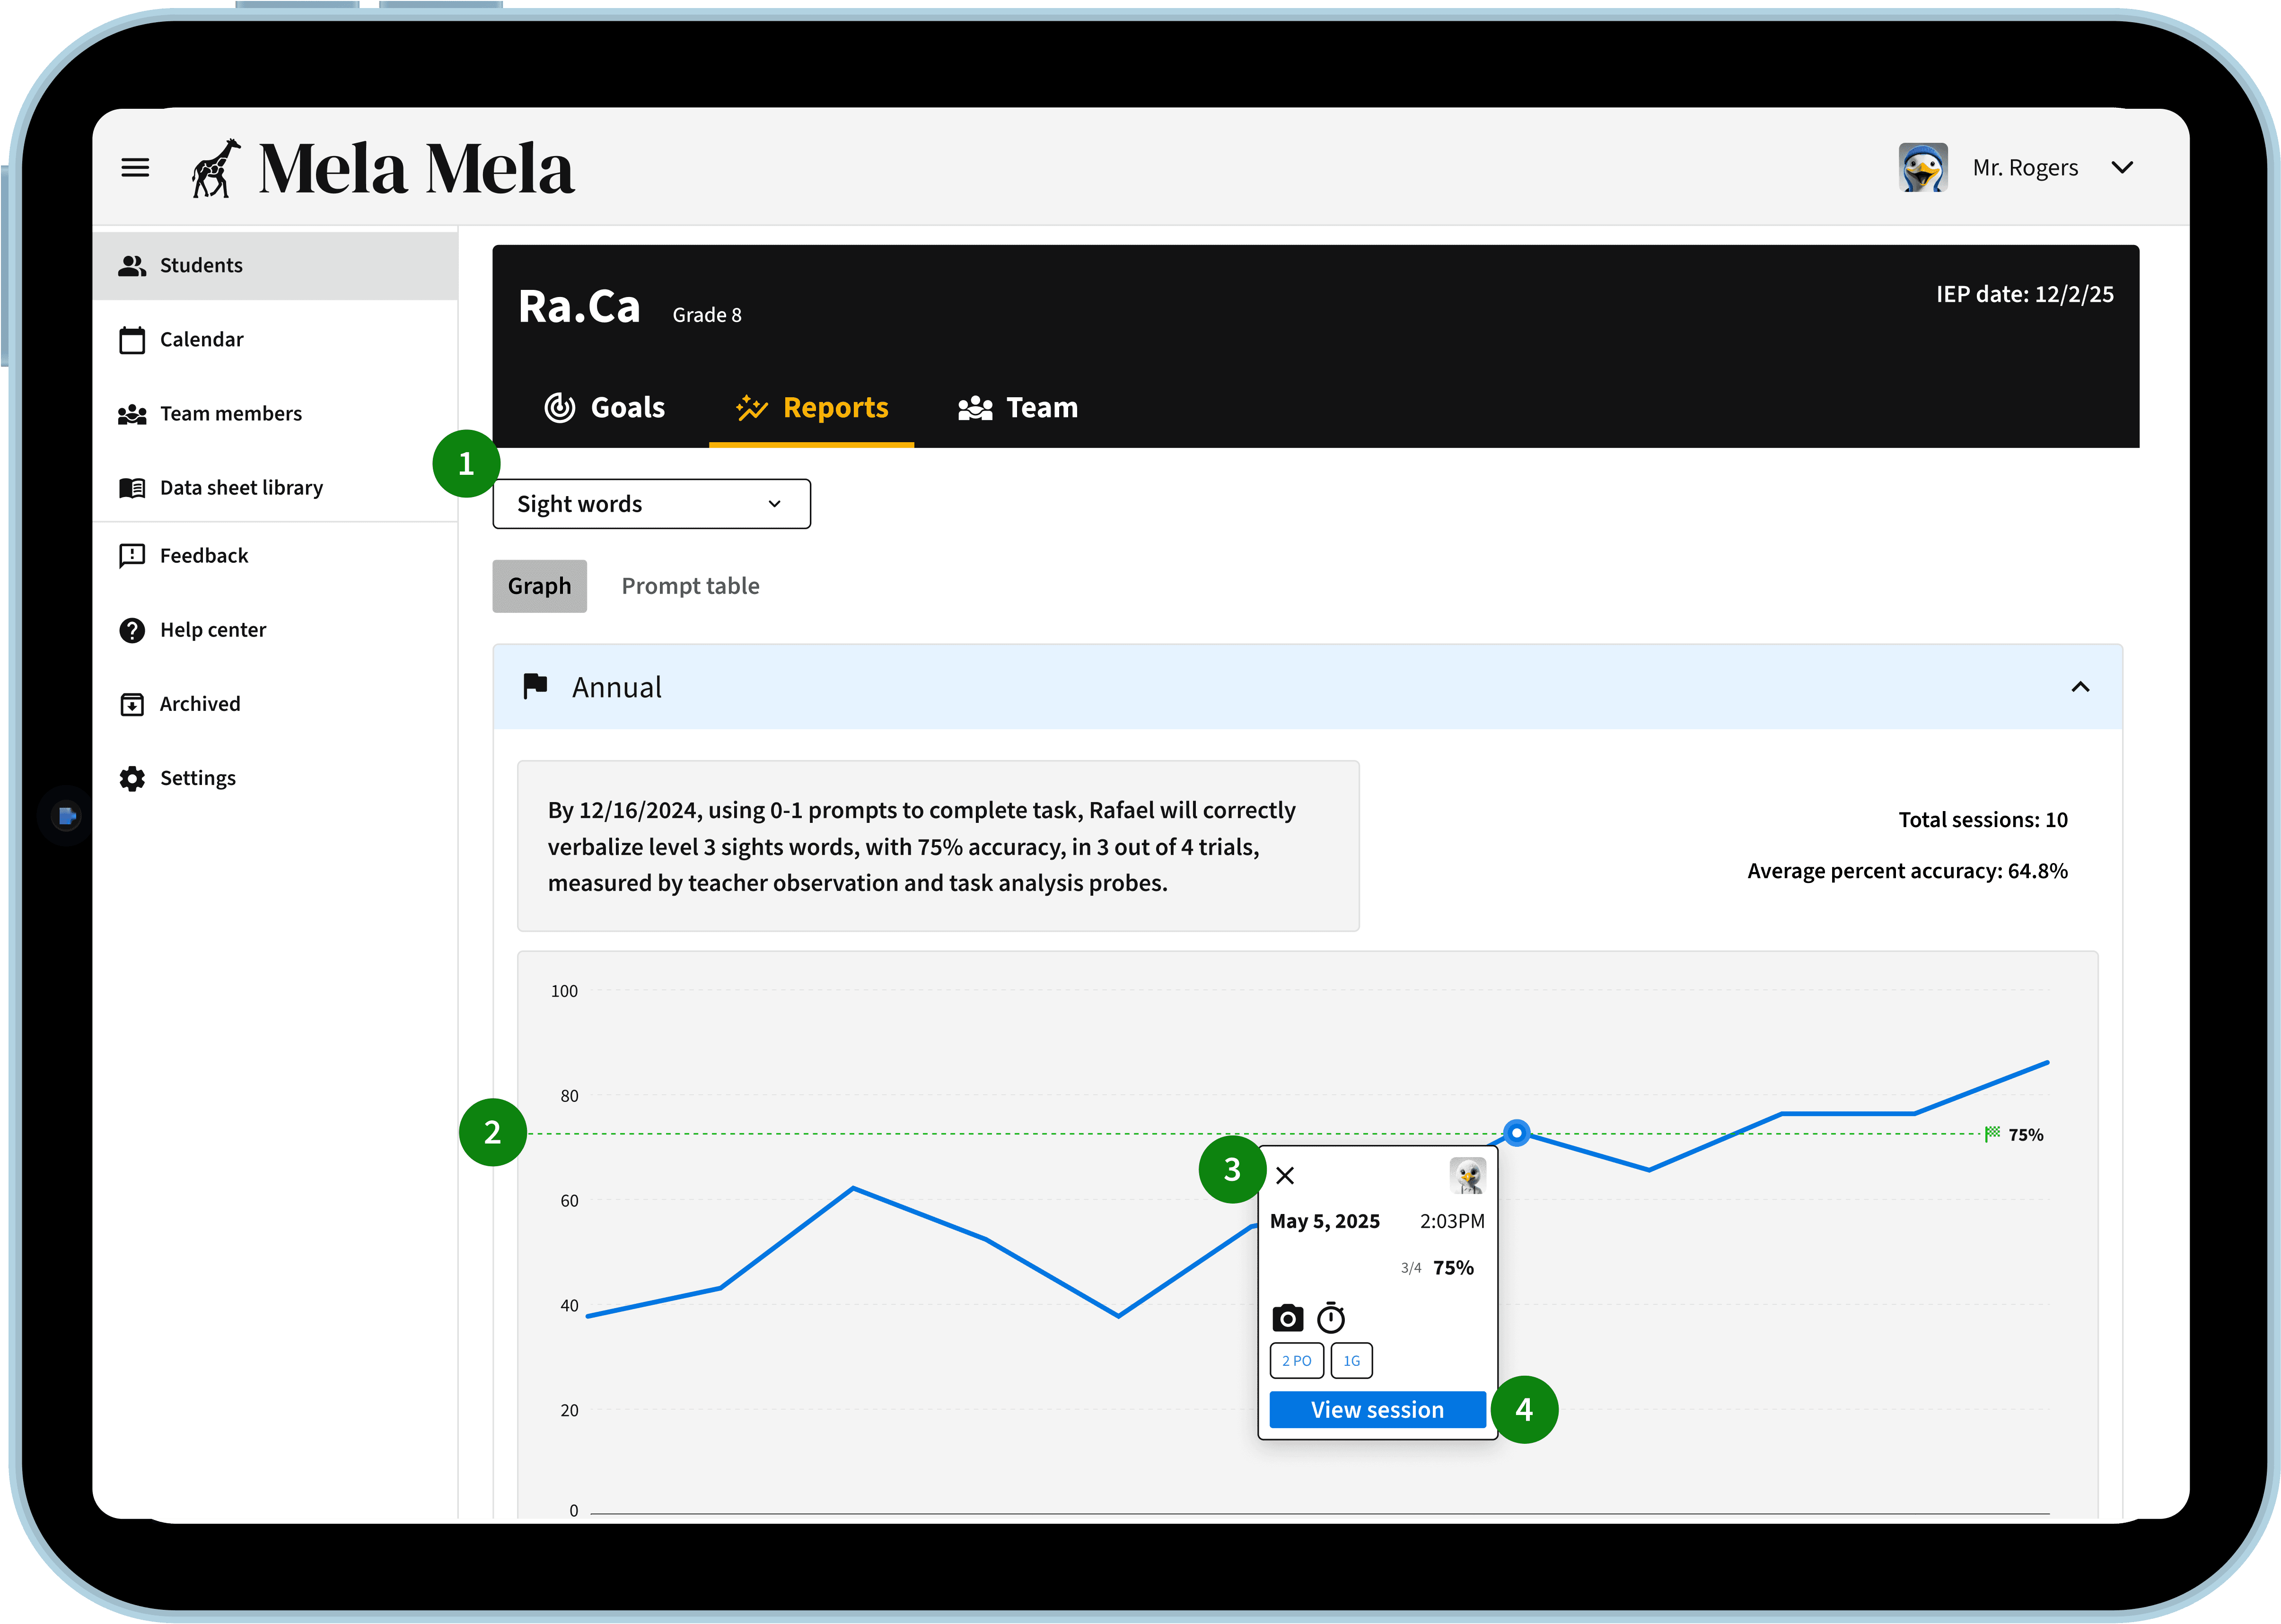
0.6 — Reports/Graph
Instant insights on all submitted data at teachers' fingertips.
1) Student goal dropdown 2) target accuracy 3) student snapshot modal with high-level data 4) "View session" button gives admins the ability to audit, edit, and delete session (if necessary)
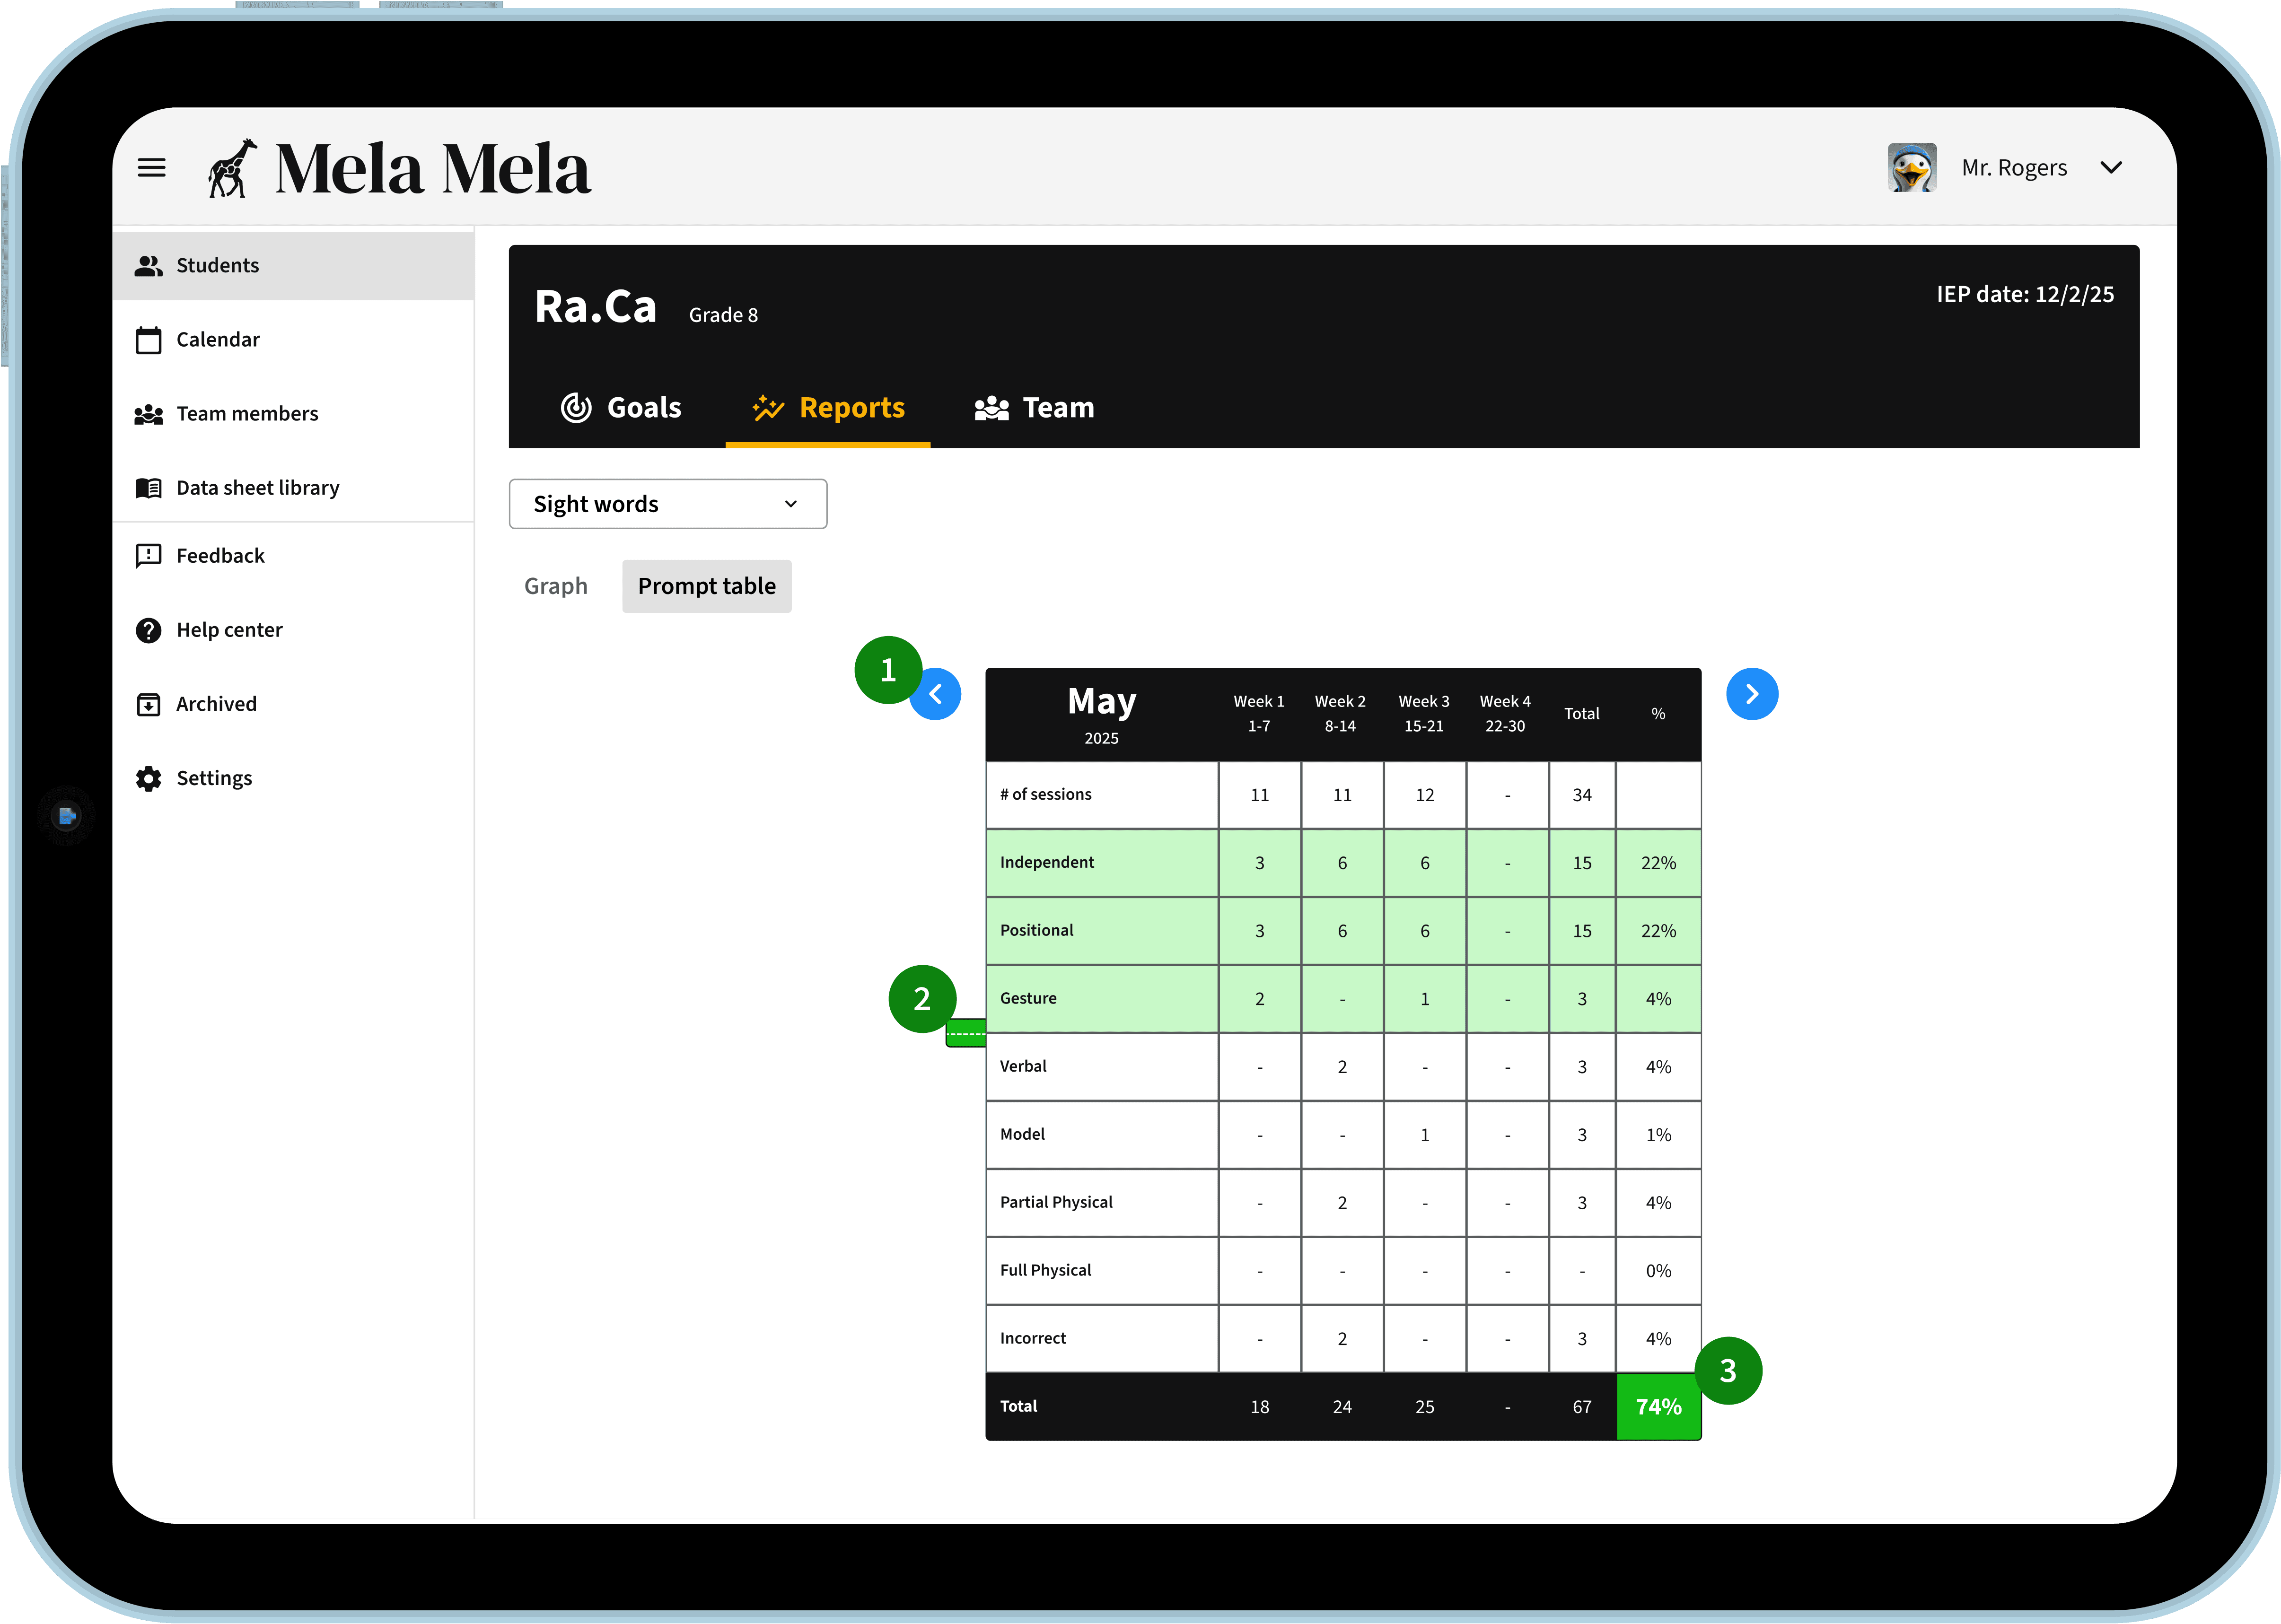
0.7 — Reports/Prompt table
Our innovative prompt table give teachers a finger on the pulse for exactly where their student is performing in relation to the amount of help they are receiving.
1) toggle between months 2) vertical baseline drag 3) dynamic percentage based on the vertical drag hierarchy.
RESULTS & IMPACT ON USERS
Understanding What Worked
Mela Mela's key metrics indicate we're on the right track. The data below is from our first completed school district pilot (Jan - April 25').
📈
Average of 700 goal submissions per month (20 core users), 98% paraprofessional driven
📈
We saw a 95% reduction in time spent synthesizing data = faster time to value through clearer data visibility and more consistent, data-driven communication among classroom teams.
📈
90% of support/feedback tickets come from paraprofessional staff indicating strong participation and sharing of duties.
RETROSPECTIVE
Feature Takeaways
Our vision is clear: streamline and standardize data collection in special education to reduce teacher stress, improve consistency, and deliver measurable value to teachers. We set out to replace fragmented, paper-based workflows with a digital system designed for real classroom teams (most importantly paraprofessionals) who play a critical role in daily data entry. The product needed to support quick goal imports, surface instant insights, and fit seamlessly into the day-to-day rhythms of special education environments.
What moves us forward: Our motivation and team moral is driven by our north star metric — submitted data collection events. Ongoing feedback from from users allows us to continue documenting user needs. Describing these needs to our internal team keeps everyone aligned with prioritization. Most importantly, pilot feedback loops validate we are delivering measurable value. Teachers estimate it will save them 30 minutes per student per quarterly reporting period.
With each round of feedback, we get closer to a system that brings the entire classroom team together. The work ahead is ongoing and our foundation is strong. Mela Mela is built for real classrooms and remains committed to making careers in special education more sustainable.